
(T2108 measures the percentage of stocks trading above their respective 40-day moving averages [DMAs]. It helps to identify extremes in market sentiment that are likely to reverse. To learn more about it, see my T2108 Resource Page. You can follow real-time T2108 commentary on twitter using the #T2108 hashtag. T2108-related trades and other trades are occasionally posted on twitter using the #120trade hashtag. T2107 measures the percentage of stocks trading above their respective 200DMAs)
T2108 Status: 49.7%
T2107 Status: 30.8%
VIX Status: 16.9
General (Short-term) Trading Call: neutral (just switched from bearish)
Active T2108 periods: Day #33 over 20%, Day #32 over 30%, Day #3 over 40% (overperiod), Day #5 below 50%, Day #7 under 60%, Day #347 under 70%
Reference Charts (click for view of last 6 months from Stockcharts.com):
S&P 500 or SPY
SDS (ProShares UltraShort S&P500)
U.S. Dollar Index (volatility index)
EEM (iShares MSCI Emerging Markets)
VIX (volatility index)
VXX (iPath S&P 500 VIX Short-Term Futures ETN)
EWG (iShares MSCI Germany Index Fund)
CAT (Caterpillar).
IBB (iShares Nasdaq Biotechnology).
Commentary
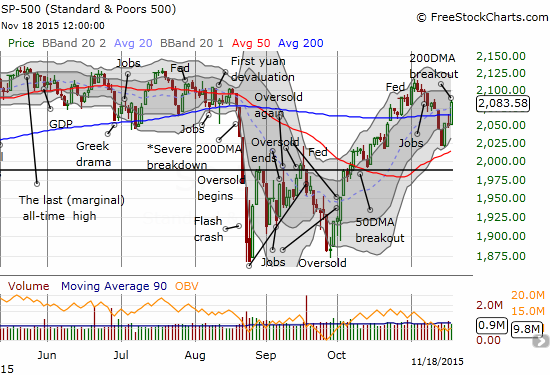
And just like that, the S&P 500 (SPY) has flipped the script. Today’s 1.6% gain on the S&P 500 bullishly pushed the index through resistance at the 200-day moving average (DMA).
The proximate reason for the rally was the release of the minutes from the last Fed meeting. However, this 5-minute chart makes it clear that buyers had a rally in mind ahead of the minutes.
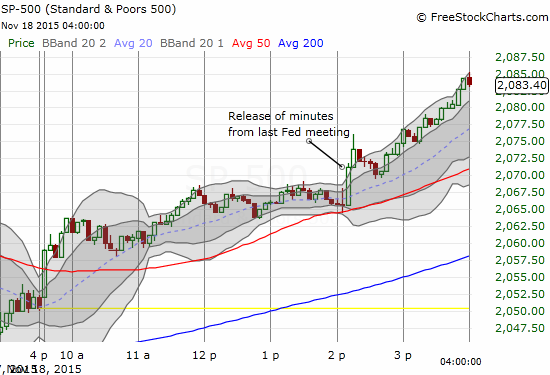
Some media outlets guessed that the market got giddy because the minutes suggested that a December rate hike is now near certain. I bolded a guilty quote below. Also note the surrounding text: the Fed clearly kept up the aura of flexibility with all the standard conditionals, including a reminder that ALL policy options remain open.
“In its postmeeting statement, rather than framing its near-term policy path in terms of how long to maintain the current target range, the Committee decided to indicate that, in determining whether it would be appropriate to raise the target range at its next meeting, it would assess both realized and expected progress toward its objectives of maximum employment and 2 percent inflation. Members emphasized that this change was intended to convey the sense that, while no decision had been made, it may well become appropriate to initiate the normalization process at the next meeting, provided that unanticipated shocks do not adversely affect the economic outlook and that incoming data support the expectation that labor market conditions will continue to improve and that inflation will return to the Committee’s 2 percent objective over the medium term. Members saw the updated language as leaving policy options open for the next meeting. However, a couple of members expressed concern that this wording change could be misinterpreted as signaling too strongly the expectation that the target range for the federal funds rate would be increased at the Committee’s next meeting.”
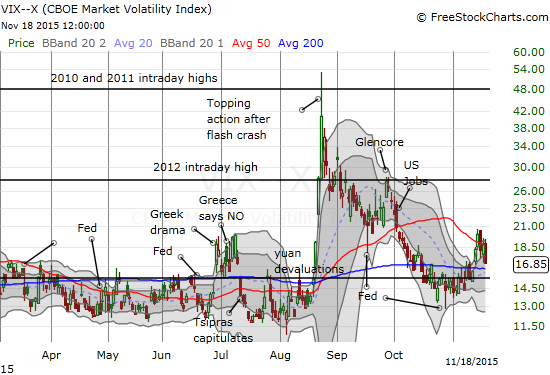
While I really cannot see a direct connection between these minutes and the market’s celebration, the end result matters most. The rally was similar enough to the good ol’ soothing effect the market tends to get after a Fed announcement on monetary policy. In this case, volatility was elevated going into trading today. It was a great pre-Fed setup to fade volatility, but I did not have this trade on my radar until December’s meeting. The volatility index, the VIX, tumbled 10.6%. It is still above the pivot point.
T2108 closed at 49.7% and confirmed once again that a reading below 40% can be sufficient to create a tradeable bottom. With T2108 sitting at a perfectly neutral level and with the S&P 500 flipping the script, I flipped the trading bias right back to neutral. The S&P 500 is above its 200DMA again and sitting in a bullish position. The short-term trading call is not bullish because of the bearish signs I recounted in previous posts starting on November 9th. I can only get outright bullish if the index can bring enough buying power to make a new all-time high AND punch through overbought status (T2108 greater than 70%).
As I noted in the T2108 Update on November 13th, I already locked in profits on a bunch of puts and short positions in the sell-off. As a result, this change in trading bias mainly means I am no longer looking to aggressively short anything. I DID finally buy some call options on ProShares Ultra VIX Short-Term Futures ETF (UVXY) expiring n December 4, 2015 as one last hedge. From here, my new trades are more likely to be on the bullish side as long as the S&P 500 remains above its 200DMA. If the S&P 500 pulls back again, I will be eyeing how the index behaves around a now rising 50DMA.
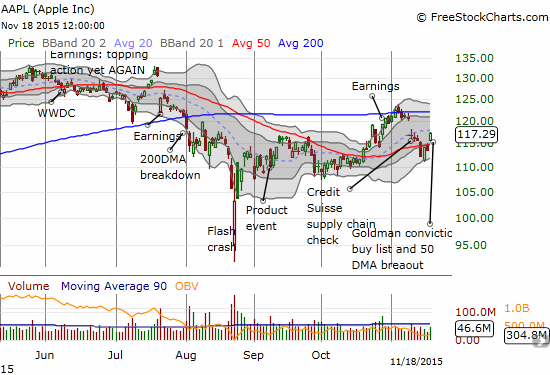
Apple (AAPL) provided an excellent symbol of the market’s dramatic turn-around. In the last T2108 Update, I caught up on AAPL’s technical breakdown from last Friday. Today, AAPL gapped up over its 50DMA. The apparent catalyst was a Goldman Sachs (GS) recommendation that put AAPL on its conviction buy list. This is a VERY bullish move.
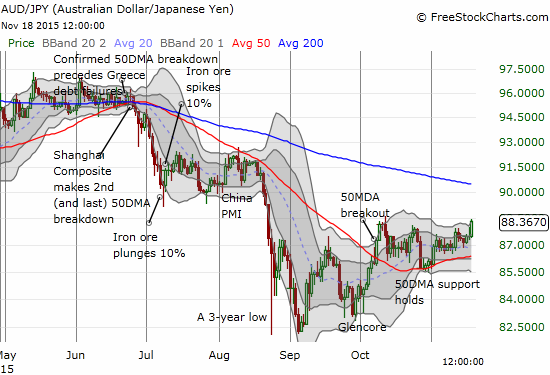
When the market whipsaws as it has, I like to turn to the currency market for more clues. Sure enough, the Australian dollar (FXA) is suddenly on the move. The Australian dollar versus the Japanese yen (FXY), AUD/JPY has seemingly confirmed 50DMA support and looks ready to print its own breakout. I will have to get incrementally more bullish on stocks on such a move.
Daily T2108 vs the S&P 500
")
Black line: T2108 (measured on the right); Green line: S&P 500 (for comparative purposes)
Red line: T2108 Overbought (70%); Blue line: T2108 Oversold (20%)
Weekly T2108

*All charts created using freestockcharts.com unless otherwise stated
The charts above are the my LATEST updates independent of the date of this given T2108 post. For my latest T2108 post click here.
Related links:
The T2108 Resource Page
Expanded daily chart of T2108 versus the S&P 500
Expanded weekly chart of T2108
Be careful out there!
Full disclosure: short the Australian dollar, long UVXY call options
The Fed minutes gave the market the nearest thing it will get to a guarantee of what the future holds for the next year at least. The market hates not knowing, and loves knowing. Thus the positive reaction.
I look for firming in interest-rate-sensitive equities, maybe even a quiet but steady rally. Like TLT.
So it was interesting then that Fed Futures only bumped up a little. They should be u toward 80% by now…!