
(T2108 measures the percentage of stocks trading above their respective 40-day moving averages [DMAs]. It helps to identify extremes in market sentiment that are likely to reverse. To learn more about it, see my T2108 Resource Page. You can follow real-time T2108 commentary on twitter using the #T2108 hashtag. T2108-related trades and other trades are occasionally posted on twitter using the #120trade hashtag. T2107 measures the percentage of stocks trading above their respective 200DMAs)
T2108 Status: 43.5%
T2107 Status: 27.7%
VIX Status: 18.4
General (Short-term) Trading Call: bearish
Active T2108 periods: Day #29 over 20%, Day #28 over 30%, Day #28 over 40% (overperiod), Day #1 below 50% (underperiod), Day #3 under 60%, Day #343 under 70%
Reference Charts (click for view of last 6 months from Stockcharts.com):
S&P 500 or SPY
SDS (ProShares UltraShort S&P500)
U.S. Dollar Index (volatility index)
EEM (iShares MSCI Emerging Markets)
VIX (volatility index)
VXX (iPath S&P 500 VIX Short-Term Futures ETN)
EWG (iShares MSCI Germany Index Fund)
CAT (Caterpillar).
IBB (iShares Nasdaq Biotechnology).
Commentary
@r0senberger84 – if S&P 500 closes below 200DMA, then betting on increased volatility makes a lot of sense. $SPY
— Duru A (@DrDuru) Nov. 12 at 11:26 AM
I have been writing this week about the deteriorating underlying technicals of the stock market. Today’s 1.4% drop in the S&P 500 (SPY) caused a breakdown of 200-day moving average (DMA) support and confirmed all the red flags. Accordingly, I have changed the short-term trading call from “slightly bearish” to bearish.
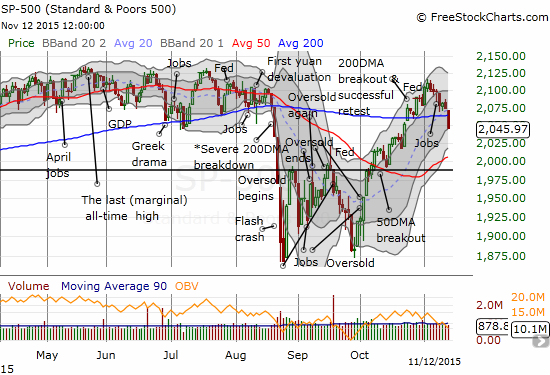
Note that I am still not aggressively bearish because the 50DMA is now turning upward and SHOULD provide strong support absent a definitive negative catalyst. The next assessment will likely depend on how well the S&P 500 trades around its 50DMA.
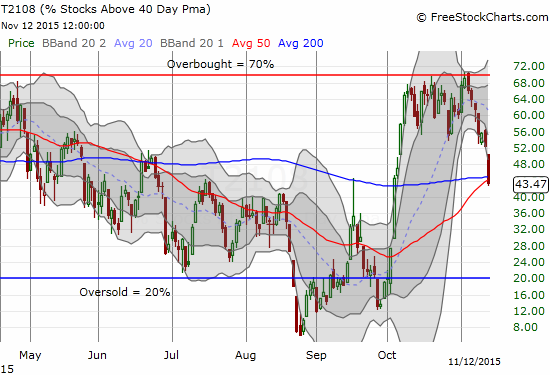
Accompanying the breakdown was a plunge in T2108. The percentage of stocks trading above their respective 40DMAs plunged from 52.6% to 43.5%. This drop completes and confirms the end of a month long range for T2108.
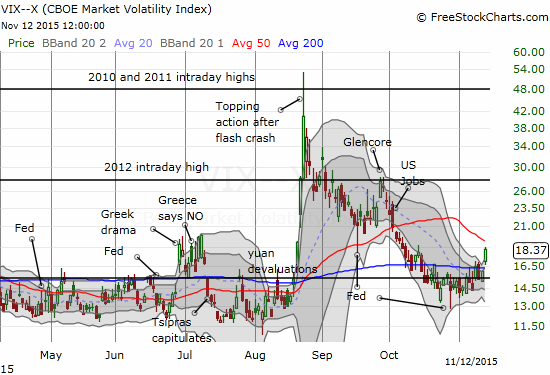
The volatility index, the VIX, joined the bumrush by breaking out to a 5-week high. I did NOT use this occasion to fade volatility as I often do. Besides, there is no imminent meeting of the Federal Reserve to help grease the skids for volatility. That will be a trade for mid-December.
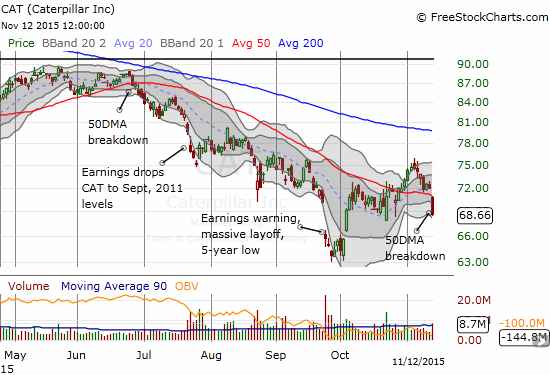
The number one confirmation of a bearish turn of events comes from Caterpillar (CAT), my favorite hedge against bullishness. CAT lost 4.5% on its way through a gap down and very bearish 50DMA breakdown. Note what happened after the last 50DMA breakdown in June.
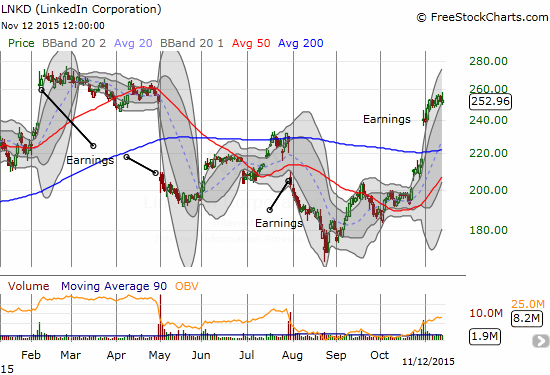
Given my change in trading call, I finally sold my call spread on LinkedIn (LNKD). It is part of a small group of tech-related stocks that have diverged from the market to form a very thin spear of leaders trying to cajole the market higher.
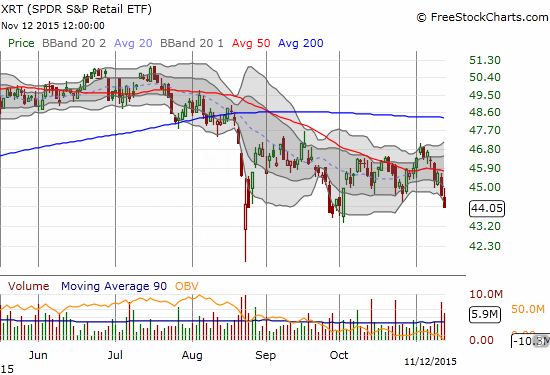
Retail is another sector that has suddenly started to suffer. Once again, we should all take pause to note how the discount on oil is NOT providing a notable boost in the prospects for many retail companies. Wal-Mart (WMT) made a big splash this earnings season with a massive post-earnings loss. Surprisingly, value investors have yet to commit and the stock is down another 5% since earnings. At that time, WMT helped the SPDR S&P Retail ETF (XRT) fail at 50DMA resistance. XRT attempted a meager rally soon thereafter but is now trading at a near 6-week low. It even looks ready for an extended run of losses.
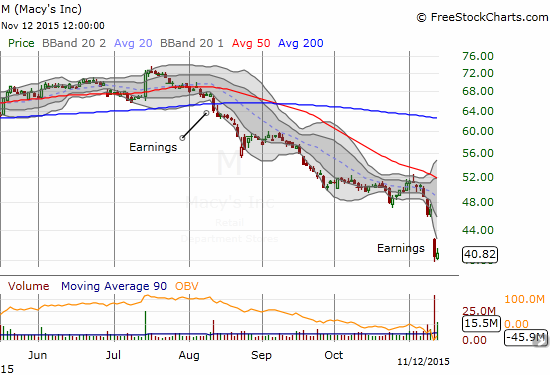
I noticed in after-hours trading Nordstrom (JWN) fell 20% after reporting earnings. See below for a chart of what happened to Macy’s (M) after it reported earnings this week. The CEO was on-air blaming unseasonably warm weather in the Northeast for a shortfall in winter shopping. The irony in these excuses is that we are quick to celebrate the benefits of lower oil prices, so why not celebrate the “dividend” consumers get for not having to spend as much money on fall/winter gear? Of course, part of the reason is that we EXPECT/want consumers to spend the oil savings on retail goods…
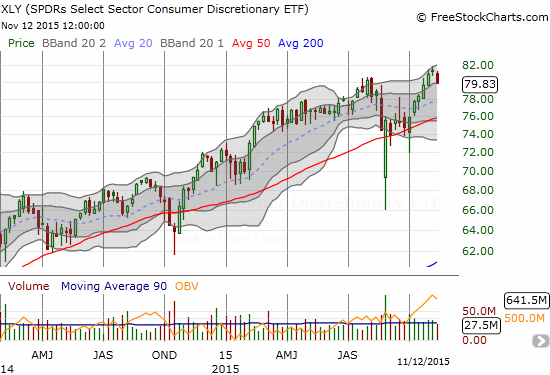
Outside of tech, there are of course still some sectors doing well or at least hanging in there on the year. For example, consumer discretionary as a whole is actually doing well where retail specifically is not.
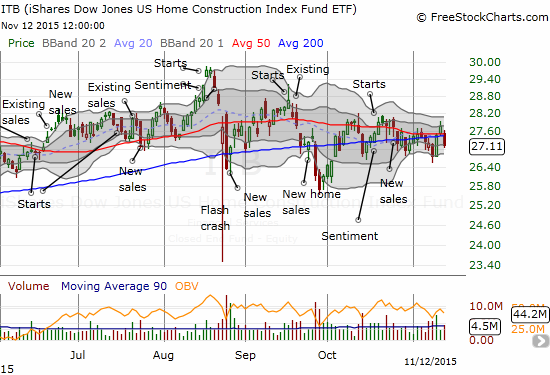
Finally, homebuilders, in the form of the iShares US Home Construction (ITB), has kept to a tight trading range nearly all year. This week, ITB was helped by a very strong report from DR Horton Inc. (DHI). Those gains are now on sharp retreat. I am still bullish on ITB and many of its components, but I am more cautious than ever right now. I will continue to buy dips and sell some rallies.
Daily T2108 vs the S&P 500
")
Black line: T2108 (measured on the right); Green line: S&P 500 (for comparative purposes)
Red line: T2108 Overbought (70%); Blue line: T2108 Oversold (20%)
Weekly T2108

*All charts created using freestockcharts.com unless otherwise stated
The charts above are the my LATEST updates independent of the date of this given T2108 post. For my latest T2108 post click here.
Related links:
The T2108 Resource Page
Expanded daily chart of T2108 versus the S&P 500
Expanded weekly chart of T2108
Be careful out there!
Full disclosure: short CAT, long ITB call options