T2108 Update (October 30, 2015) – Post-Fed Momentum Quickly Stalls, Underlying Momentum Fades

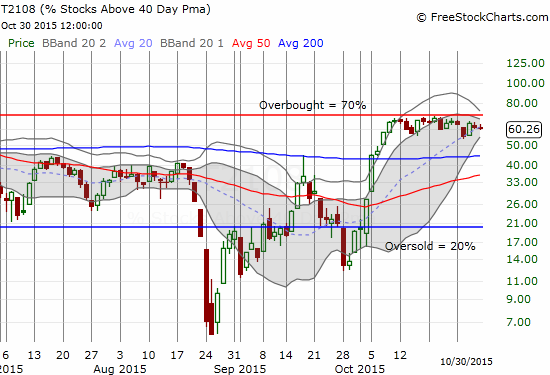
(T2108 measures the percentage of stocks trading above their respective 40-day moving averages [DMAs]. It helps to identify extremes in market sentiment that are likely to reverse. To learn more about it, see my T2108 Resource Page. You can follow real-time T2108 commentary on twitter using the #T2108 hashtag. T2108-related trades and other trades are occasionally posted on twitter using the #120trade hashtag. T2107 measures the percentage of stocks trading above their respective 200DMAs)

T2108 Status: 60.3%
T2107 Status: 32.8%
VIX Status: 15.1
General (Short-term) Trading Call: neutral, changed from mildly bearish – see below
Active T2108 periods: Day #21 over 20%, Day #20 over 30%, Day #20 over 40%, Day #18 over 50%, Day #3 over 60% (overperiod), Day #335 under 70% (underperiod)

Reference Charts (click for view of last 6 months from Stockcharts.com):
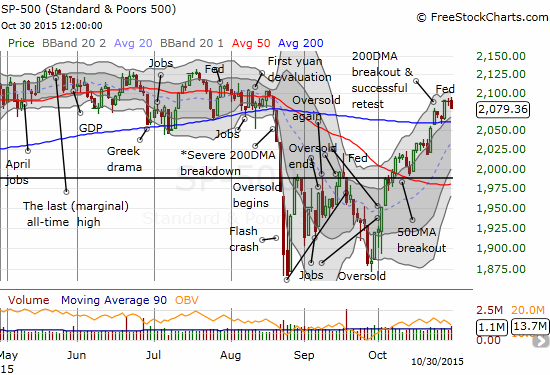
S&P 500 or SPY
SDS (ProShares UltraShort S&P500)
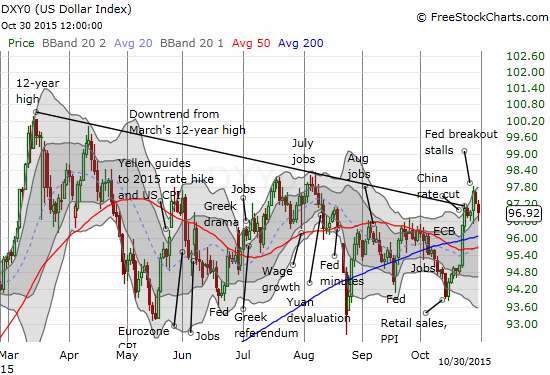
U.S. Dollar Index (volatility index)
EEM (iShares MSCI Emerging Markets)
VIX (volatility index)
VXX (iPath S&P 500 VIX Short-Term Futures ETN)
EWG (iShares MSCI Germany Index Fund)
CAT (Caterpillar).
IBB (iShares Nasdaq Biotechnology).

Commentary
After the U.S. Federal Reserve announced its latest decision on monetary policy, the S&P 500 (SPY) extended its breakout. The U.S. dollar also broke out. In the two days since, both have stalled out.


The S&P 500's post Fed rally has already stalled.
The S&P 500’s post Fed rally has already stalled.


No post-Fed follow-through yet for the U.S. dollar index

Incredibly, T2108 has still failed to cross the overbought threshold. In fact, the momentum on my favorite technical indicator is ever so subtly waning. On Wednesday, T2108 only reached a high of 65.4%. It is now back to 60.3%. This is T2108’s 4th lowest close since the churn directly underneath the overbought threshold began over three weeks ago. This waning momentum is a slightly bearish sign as it contradicts the apparent momentum from the S&P 500.


It is very subtle, but T2108 is slowly but surely losing momentum. As it does so, it acts as a con-confirming indicator to the on-going rally for the S&P 500 (SPY).

When the S&P 500 tagged its 200DMA support, I posted a red flag on the market technicals as T2108 made its lowest close during this period of churn. At the time, iShares Transportation Average ETF (IYT) appeared to validate my concerns. Since then, IYT has managed to hold support at its 50DMA. So, overall, my trading call remains at neutral. As a reminder, I am assuming it makes little to no sense get aggressive on short positions until/unless the S&P 500 closes below 200DMA support. On the flip side, a breakout for T2108 into overbought territory will likely trigger my trading rules for riding the momentum of an overbought rally.

The volatility index, the VIX, is still making no news. For two weeks, the VIX has bounced in a very tight range neatly around the 15.35 pivot. I never cease to marvel at how well this pivot actually works. I am assuming a breakout/down from this pivot will be consistent with market sentiment and will thus will help drive directional trades.

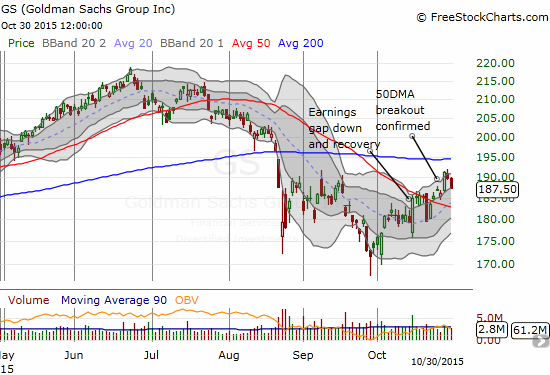
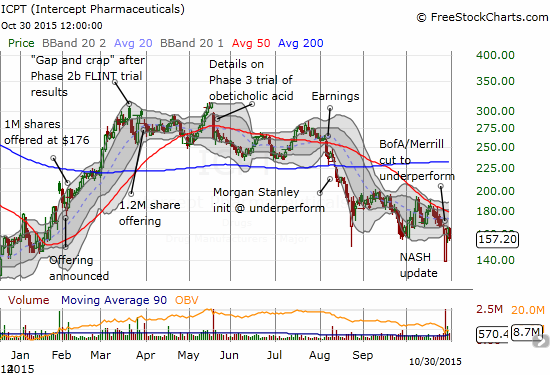
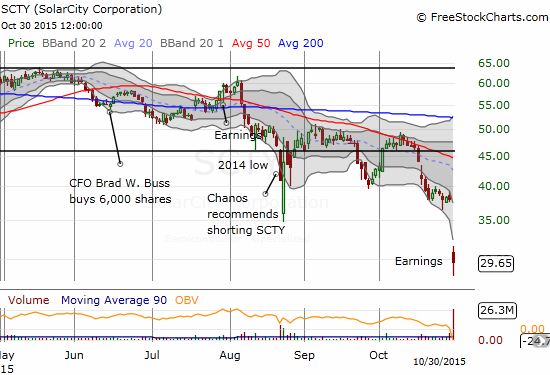
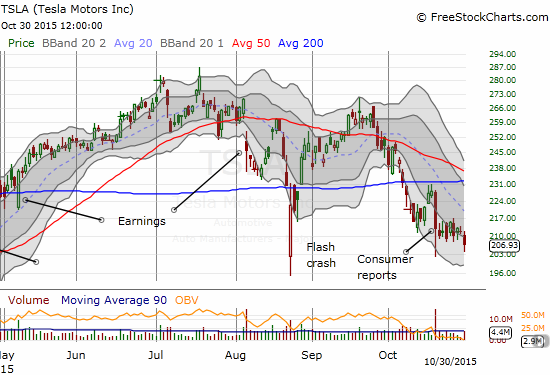
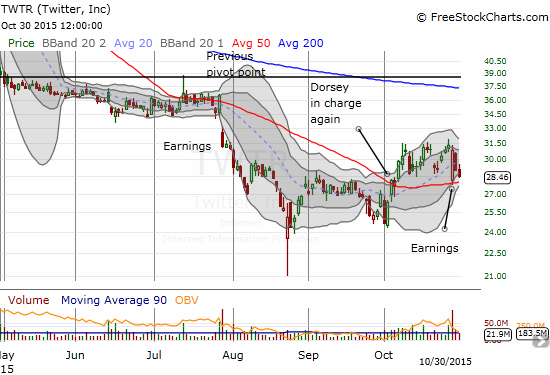
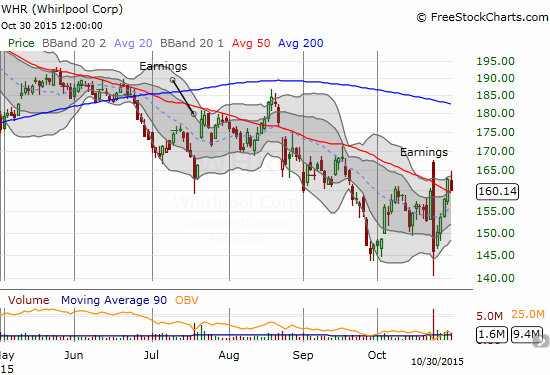
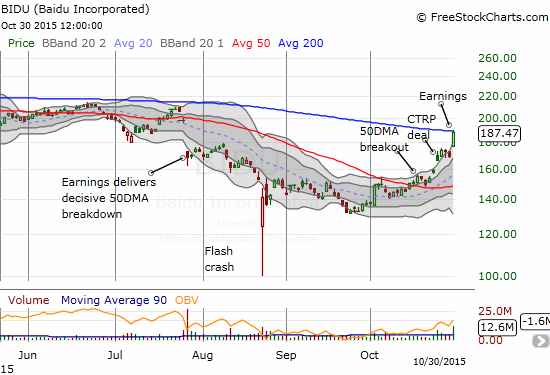
While this suspense continues to build, earnings season rolls along. Plenty of drama abounds in individual stocks. Some juicy post-earnings reversals continue to provide great trading opportunities as well. Here are a few sample charts with commentary in the captions.


Goldman Sachs (GS) has followed through with its major post-earnings reversal. It is now stalling around the September highs and right below its 200DMA.

Intercept Pharmaceuticals, Inc. (ICPT) plunged after its latest update on drug trials. Buyers stepped right in and completely closed the gap. Momentum has stalled since then.
Solar City (SCTY) followed through on multiple failures at 50DMA resistance with a post-earnings collapse to 2-year lows. The previous trading range (in dark, horizontal lines) is a distant memory.
Tesla Motors (TSLA) approaches earnings on Nov 3rd with a weak hand. Buyers have yet to step into the breach after criticism from Consumer Reports.
A post-earnings sell-off for Twitter (TWTR) stopped cold at 50DMA support. Buyers nearly closed the entire gap but buying momentum has since stalled.
Whirlpool (WHR) put on one of the bigger shows I have seen during this earnings season. WHR reported in the morning with a gap up. Sellers stepped in for the rest of the day as reactions turned negative to the conference call. Buyers took over again to register a net post-earnings gain. Note however that WHR is overall still following its 50DMA downward.

Baidu (BIDU) has almost closed the big post-earnings gap down from July. Missing this resurgence has hurt, but I simply could not buy into the 50DMA breakout ahead of earnings at this juncture in the market. BIDU buyers are clearly snatching back control of this stock. A 200DMA breakout would add yet more confirmation.


Daily T2108 vs the S&P 500

Black line: T2108 (measured on the right); Green line: S&P 500 (for comparative purposes)
Red line: T2108 Overbought (70%); Blue line: T2108 Oversold (20%)


Weekly T2108
Weekly T2108
*All charts created using
freestockcharts.com unless otherwise stated

The charts above are the my LATEST updates independent of the date of this given T2108 post. For my latest T2108 post click here.

Related links:
The T2108 Resource Page
Expanded daily chart of T2108 versus the S&P 500
Expanded weekly chart of T2108

Be careful out there!

Full disclosure: short GS, short TWTR put options

Leave a Comment

This site uses Akismet to reduce spam. Learn how your comment data is processed.