
In my last market update, I neglected to pay homage to the extraordinary monthly performance of October, 2015. You have probably heard or read the headlines that last month delivered the biggest gain in four years. October was up 8.9% – one of the best and fastest bounces from oversold territory in a long time. Here is a chart for perspective.
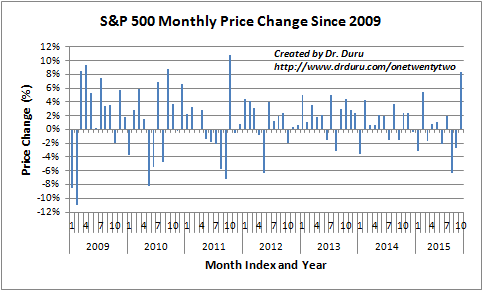
Source for prices: Yahoo Finance
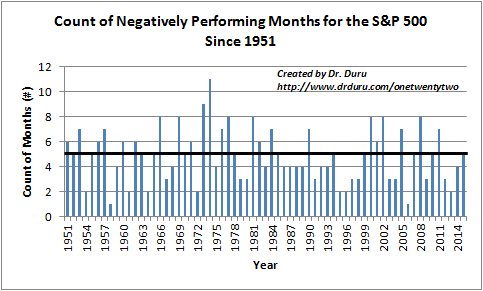
Notice how 2015 has delivered THREE extraordinary months in this post-crisis period. At the time, February of this year was the biggest monthly performer since October, 2011. August of this year was the worst performer since May, 2012 – just by a hair. If you prefer to call it a tie, then August was the worst since September, 2011. Astute observers will also notice that 2015 has already had more negatively performing months (5) than any other year since 2011. Here is a chart that shows the count of negative months on a yearly basis since 1950. The black horizontal shows the median: 5.
In other words, we were spoiled in the previous three years.
It is tempting to say that the S&P 500 is now done with negative months since 2015 has reached the median. While stock market seasonality suggests that the remainder of the year should bring better tidings, this is of course not a guarantee. Given 2015 has turned into an extraordinary year, perhaps it is more relevant and useful to expect an extraordinary finish…
Be careful out there!
Full disclosure: no positions