
At the timing of writing, Apple (AAPL) is up 0.6% for the year, essentially flat. When I last wrote about the Apple pre-earnings trade back in January, I looked back at the December 1, 2014 “flash dip” in AAPL’s stock as a lingering harbinger of more selling to come. As it turned out, AAPL sold off 3.5% on the day just ahead of earnings and popped back up 5.7% the next day. By early February, the flash dip was finally invalidated as a bearish signal. The celebration was short-lived as AAPL peaked out by late February on its way to a very rare quadruple top. That top was confirmed with the post-earnings gap down in July, and AAPL has not been the same since. A downtrending 50-day moving average (DMA) now has the stock firmly under its spell.
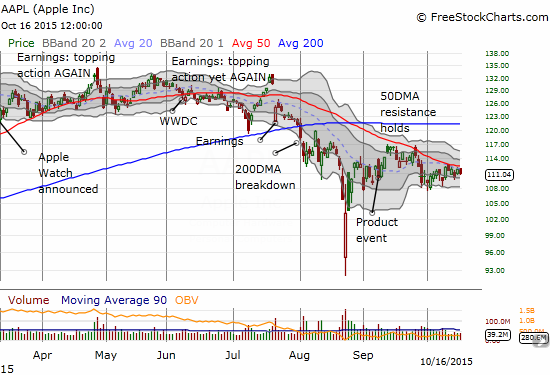
Source: FreeStockCharts.com
This is now a critical juncture for AAPL. October, 2015 earnings arrive after market hours on the 27th. If AAPL does not break out by then, 50DMA resistance will loom even larger as a major test of AAPL’s near-term direction. Also looming over the stock are all the fears about China’s economic deceleration (the rate of growth is declining). China delivered gangbuster numbers for AAPL in July earnings and yet the market was not mollified. Imagine what could happen this time around if China does not deliver? Especially consider the high expectations for China sales given Tim Cook’s recent insistence that China is doing just fine for AAPL. From a TheStreet.com article on August 24th (yes, the day of the flash crash that epitomized the August angst) titled “Here’s What Tim Cook Told Jim Cramer About Apple’s Results in China” (article includes a 47-second video with Cramer’s commentary on Cook’s email):
“First tweeted by CNBC’s Carl Quintanilla, Cook wrote that there is ‘strong growth for our business in China through July and August,’ noting that iPhone activations have accelerated over the past few weeks.”
As far as I know, there are no early indications on how things have gone since the last week of August. Unless AAPL provides early news of a big upside/downside swing, we will not know until earnings are announced.
When it comes to AAPL, I do not speculate or guess about the fundamentals. Instead, I focus on the technicals and try to sort out what the market is currently doing with the stock. When it comes to Apple’s earnings, there are a few distinct patterns that set up good risk/reward trades ahead of earnings. I am updating here all the data and provide an assessment of how to trade. In summary, it all depends on how AAPL behaves in this final week ahead of earnings.
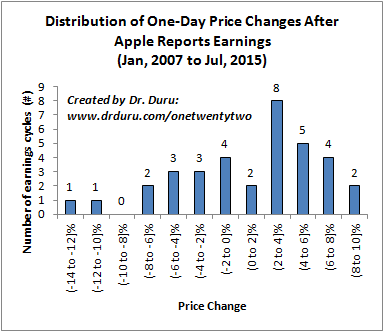
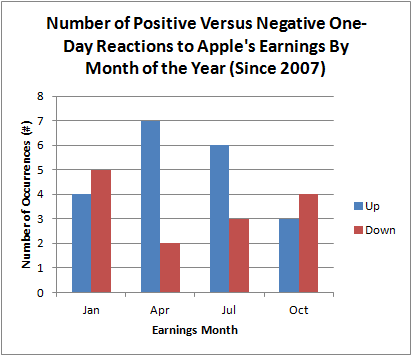
First of all, AAPL has a strong tendency to print a gain the day after posting earnings. April and July are the two months most likely to get the benefit of post-earnings buyers. This year provided a notable exception as AAPL posted losses two cycles in a row after a four-time winning streak.
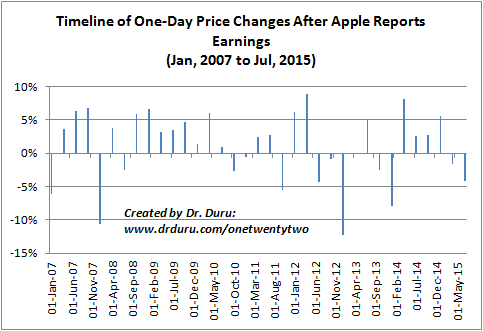
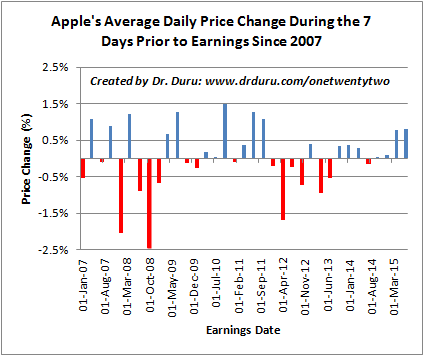
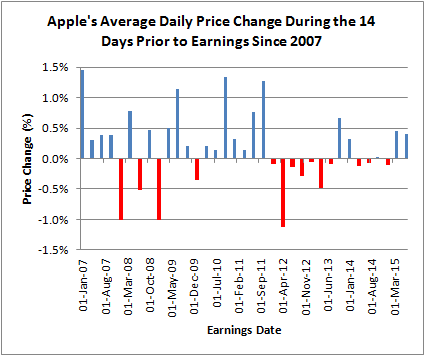
Although AAPL tends to gain the day after earnings, the market does NOT have a tendency to anticipate these gains with rallies going into earnings. In fact, until the last two earnings cycles, AAPL tended to post average daily losses in the 7 or 14 calendar days leading into earnings. Ironically, the market showed a lot of optimism going into the last two earnings cycle with sizeable average daily gains. This set up the disappointment that motivated post-earnings selling. (Note well: the count of calendar days includes the day ahead of earnings. For example, for earnings on July 21, 2015, 7 calendar days counts from July 15th to the 21st. Since this covered a weekend, only 5 trading days are included in price change calculations).
The next question of course is how are all these price changes correlated with the actual earnings reactions. The various charts show that it all depends on where you look – in other words, you have to be very selective and cautious on interpreting the data. All the following charts cover earnings since 2007.
Click for a larger image…
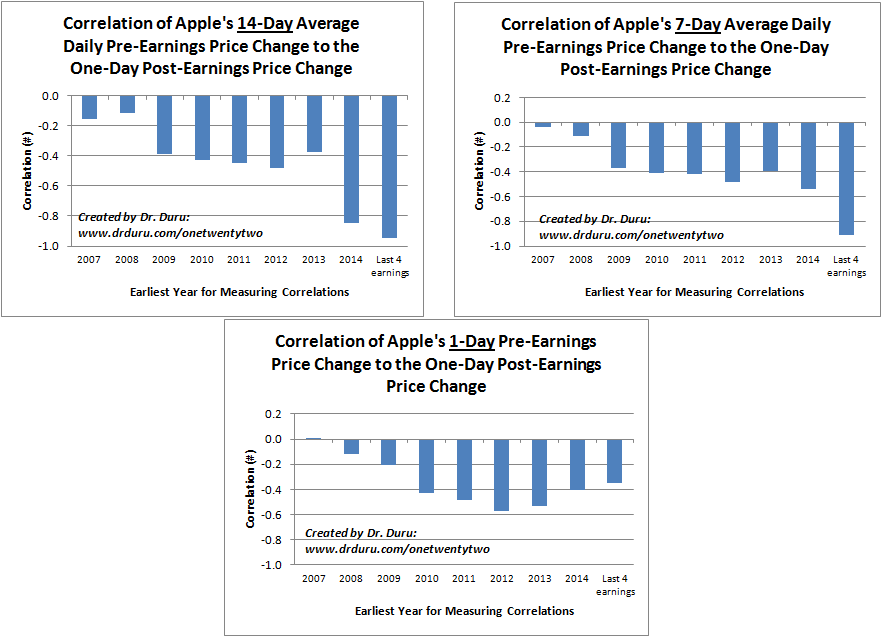
Note that while the correlations are not strong for the price change the day ahead of earnings, ALL the views of these correlations are negative (inverse correlations). In other words, do NOT chase AAPL into earnings based on the price action going into the close before earnings.
After narrowing the view by the month of earnings, April becomes a notable exception for the 1-day price change correlation. For example, the very STRONG inverse correlation worked like a charm this past April. AAPL gained 1.8% the day ahead of earnings and lost 1.6% the following day – an overall non-event. The next strongest correlation is barely tradeable with October tending toward an inverse correlation for the 7-day price change.
Click for a larger image…
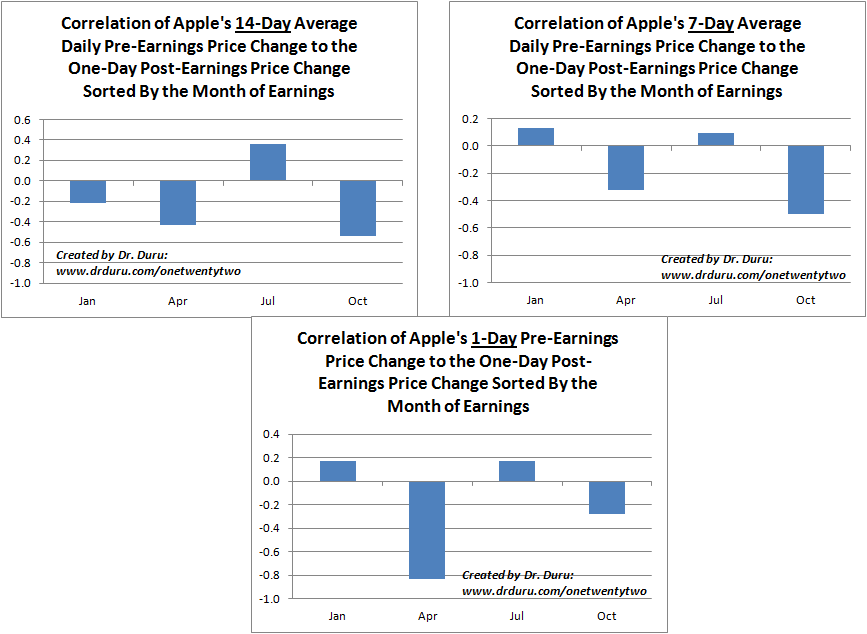
So putting this all together, the best trade going into earnings next week will likely be to fade the daily average price action from October 21st to October 27th. The bigger the move going into earnings, the more attractive the fade. Trading off pre-earnings sell-offs are slightly more attractive than pre-earnings rallies. Stay tuned. I plan to provide a final assessment just ahead of earnings. Look for a tweet on my StockTwits and/or Twitter accounts likely including the #120trade hashtag.
In final news, I have not traded the Apple Trading Model (ATM) much in recent months. Starting with the July post-earnings breakdown, I was more focused on sticking with bearish trades on AAPL. In particular, I had a put spread in play that ended up providing one of my hedges during the oversold periods; the Oct 105/110 put spread finally expired last Friday. It was difficult to let those profits come and go, but they provided a valuable cushion for making my bullish trades during the oversold periods. Now, I am focused on the 50DMA as resistance and next week’s earnings. I am looking forward to simplifying things back to the Apple Trading Model.
Be careful out there!
Full disclosure: no positions
correct your © advices, it’s 2015, not 2011 nor 2009
Thanks for the heads up! I keep forgetting to make those updates.