(This is an excerpt from an article I originally published on Seeking Alpha on September 28, 2015. Click here to read the entire piece.)
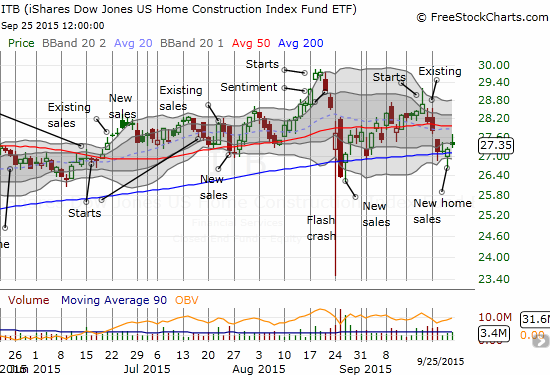
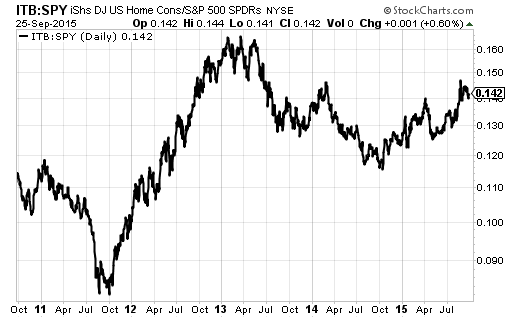
While the S&P 500 (SPY) continues to languish in the aftermath of the flash crash and accompanying sell-off, the iShares US Home Construction (ITB) is still up 5.7% for the year and just 8% off its 8-year high.

Source: FreeStockCharts.com

Source: Stockcharts.com
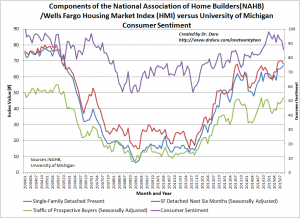
While the out-performance of ITB over SPY is not as strong as 2012’s run when homebuilders were racing off a deep trough, it is accompanied by homebuilder sentiment riding high. {snip}
Click to enlarge picture…

Source: National Association of Home Builders (NAHB) and the University of Michigan surveys of consumers
Consumer sentiment provides a notable caveat to homebuilder sentiment. {snip}
Sentiment on the housing market has notably improved at the Federal Reserve thanks to relatively strong reports coming from a large portion of the Fed’s districts. September’s Fed Beige Book covers data collected on or before August 24, 2015, so it covers a good amount of the time covered by the latest housing reports. The big headline from the report was an increase in both housing prices and sales in all 12 Fed districts:
“Contacts in many Districts attributed increases in home prices to robust demand and declining inventory…Overall, the residential outlook was positive, with the majority of Districts expecting this increased activity to continue.”
The positive outlook is the most important assessment coming out of the report. {snip}
Dallas
The eleventh district of Dallas is of greatest interest to me as the Texas housing market is very important to many homebuilders. {snip}
San Francisco
{snip} The theme out West remains that of persistent inventory shortages. It seems construction activity will slow in the second half compared to the first half thanks in part to shortages throughout the supply chain.
{snip}
Boston
Sales were strong throughout all the states of the Boston district. The strong activity has reduced inventory and decreased the time homes sit unsold on the market. The inventory shortages sound as bad as those out West.
{snip}
New York
The New York district is a mixed bag. Northern New Jersey, outside of New York City, is trying to work with an inventory overload from distressed properties. NYC proper sounds very strong.
{snip}
Philadelphia
The Philadelphia District covers Delaware, eastern Pennsylvania, and southern New Jersey. Philadelphia’s results are ok but the district sounds like one of the weakest of the Fed’s Districts.
{snip}
Cleveland
The Cleveland District covers Ohio, western Pennsylvania, the northern panhandle of West Virginia, and eastern Kentucky. The collapse in the energy sector has hit this region although overall results look strong.
{snip}
Richmond
The Richmond District ranges from Maryland on down to the Carolinas. Performance was mixed across the district with the market appearing less strong moving from the low-end of markets to the higher end.
{snip}
Atlanta
The Atlanta District covers a large swath of the South: Alabama, Florida, and Georgia, and portions of Louisiana, Mississippi, and Tennessee. I am particularly interested in Georgia as Century Communities Inc. (CCS) made a big bet in Atlanta as an area of growth to complement its core in Texas and Colorado. The reported outlooks are positive but not overwhelming. So, my expectations for CCS remain tempered for now.
{snip}
Be careful out there!
Full disclosure: long CCS, long ITB and SSO call options
(This is an excerpt from an article I originally published on Seeking Alpha on September 28, 2015. Click here to read the entire piece.)
