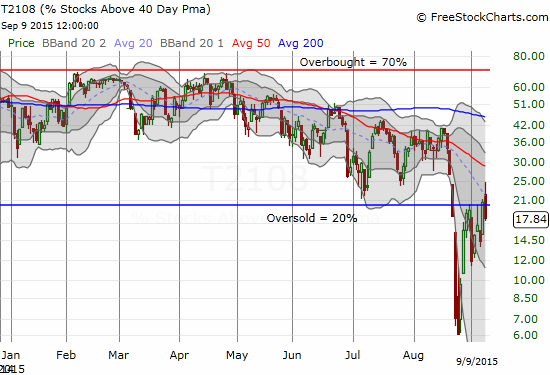
(T2108 measures the percentage of stocks trading above their respective 40-day moving averages [DMAs]. It helps to identify extremes in market sentiment that are likely to reverse. To learn more about it, see my T2108 Resource Page. You can follow real-time T2108 commentary on twitter using the #T2108 hashtag. T2108-related trades and other trades are occasionally posted on twitter using the #120trade hashtag. T2107 measures the percentage of stocks trading above their respective 200DMAs)
T2108 Status: 17.8% (Day #1 of a 2nd oversold period. Last one ended the day before.
T2107 Status: 21.4%
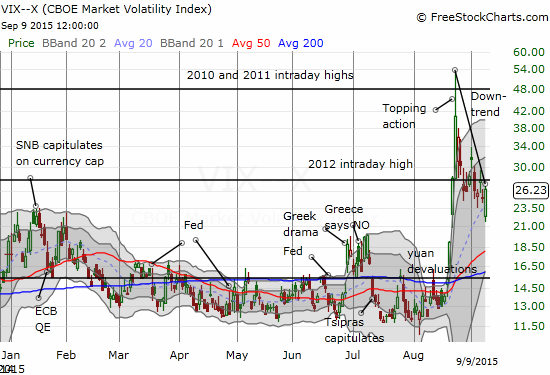
VIX Status: 26.2
General (Short-term) Trading Call: Bullish
Active T2108 periods: Day #1 under 20% (underperiod is oversold, last oversold period ended just a day before), Day #14 under 30%, Day #37 under 40%, Day #77 under 50%, Day #94 under 60%, Day #292 under 70%
Reference Charts (click for view of last 6 months from Stockcharts.com):
S&P 500 or SPY
SDS (ProShares UltraShort S&P500)
U.S. Dollar Index (volatility index)
EEM (iShares MSCI Emerging Markets)
VIX (volatility index)
VXX (iPath S&P 500 VIX Short-Term Futures ETN)
EWG (iShares MSCI Germany Index Fund)
CAT (Caterpillar).
Commentary
Here we go again.
Just one day after T2108 exited the first oversold period in almost a year, it drops right back into a second one with a close of 17.8. It looks like the battle royale between post-Labor Day bargain shoppers and anxious is officially underway.

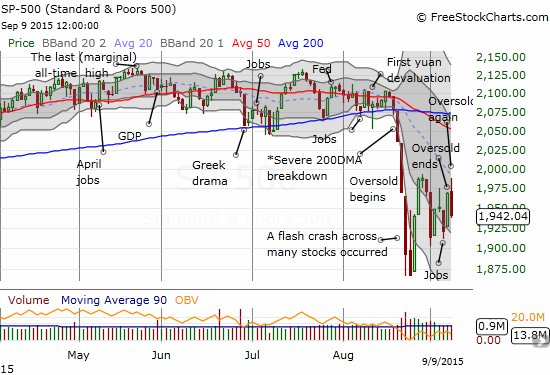
The fade on T2108 was equally matched by the S&P 500 (SPY). The index was stopped cold right at its declining 20-day moving average (DMA) which happens to coincide with the high from the oversold period.

Essentially, the stock market has developed a nervous chop as it awaits the U.S. Federal Reserve’s policy decision in a week: Fedaggedon.
The volatility index made a big comeback from its low of the day but ended the day short of the dangerzone. A subtle downtrend remains in place from the last intraday high.

With T2108 back in oversold territory, I hit a partial reset on the T2108 trading strategy. Since I am still holding positions from the last oversold period, I did not make new T2108 trades to mark the beginning of the oversold period. The rest of the rules remain the same with a caveat for the aggressive approach. As I follow the aggressive strategy, I will look for a new spike in the VIX for loading up on call options on ProShares Ultra S&P500 (SSO). Given the height of the last spike, I may trigger as early as a 20-25% approach which amounts to 43 on the high end. In the meantime, I will likely play the up and down chop that reverses the previous day’s move. I am still keenly focused on fading volatility going into the Fed meeting.
Less aggressive traders can now wait for the VIX to make a new closing low in this cycle before making a bullish trade or investment. As always, conservative traders and investors can wait until the oversold period ends before making bullish trades. The same caution on overhead resistance levels applies.
Here are the trades on the day: locked in profits on ProShares Ultra VIX Short-Term Futures (UVXY) put options as soon as it appeared UVXY would not follow-through with its gap down; later in the day, a limit order to get back into the same UVXY put options triggered at less than half my original purchase price; bought a new tranche of shares in Direxion Daily Russia Bear 3X ETF (RUSS) as a play on the uptrend and a partial hedge on longs; stubbornly bought back into call options on Workday (WDAY) as I still believe the poor timing of the earnings report greased the skids for an over-reaction; watched another Google (GOOG) call option go from profit to loss as I TRIED to stick with the winning trade. Clearly, I need to keep locking in profits on GOOG call options as soon as practical! GOOG closed the day just barely levitating above its 50DMA pivot point.
Daily T2108 vs the S&P 500

Black line: T2108 (measured on the right); Green line: S&P 500 (for comparative purposes)
Red line: T2108 Overbought (70%); Blue line: T2108 Oversold (20%)
Weekly T2108

*All charts created using freestockcharts.com unless otherwise stated
The charts above are the my LATEST updates independent of the date of this given T2108 post. For my latest T2108 post click here.
Related links:
The T2108 Resource Page
Expanded daily chart of T2108 versus the S&P 500
Expanded weekly chart of T2108
Be careful out there!
Full disclosure: long SVXY shares, long SSO shares and call options, long UVXY put options, long GOOG call options, long WDAY call options

Have there been other sequences in which a long oversold period was interrupted by a single day in which T2108 closed above 20%?
Yep! The financial crisis… There was a one day reprieve. Given the duration on either side of the break, I have often considered just adding the two periods up as one oversold period. It would make for an even more interesting outlier.