
(T2108 measures the percentage of stocks trading above their respective 40-day moving averages [DMAs]. It helps to identify extremes in market sentiment that are likely to reverse. To learn more about it, see my T2108 Resource Page. You can follow real-time T2108 commentary on twitter using the #T2108 hashtag. T2108-related trades and other trades are occasionally posted on twitter using the #120trade hashtag. T2107 measures the percentage of stocks trading above their respective 200DMAs)
T2108 Status: 29.2%
T2107 Status: 41.4%
VIX Status: 16.8
General (Short-term) Trading Call: Bullish
Active T2108 periods: Day #177 over 20%, Day #1 under 30% (underperiod), Day #4 under 40%, Day #30 under 50%, Day #47 under 60%, Day #246 under 70%
Reference Charts (click for view of last 6 months from Stockcharts.com):
S&P 500 or SPY
SDS (ProShares UltraShort S&P500)
U.S. Dollar Index (volatility index)
EEM (iShares MSCI Emerging Markets)
VIX (volatility index)
VXX (iPath S&P 500 VIX Short-Term Futures ETN)
EWG (iShares MSCI Germany Index Fund)
CAT (Caterpillar).
Commentary
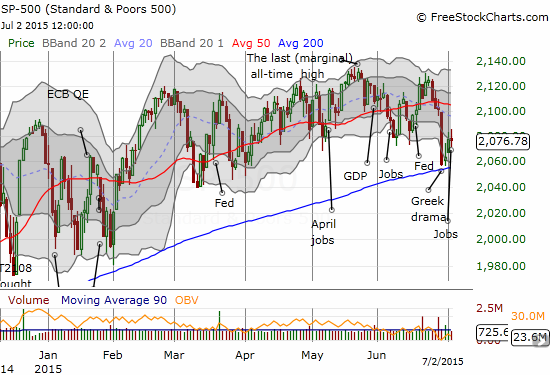
$SPY has made "reluctant" bounce from 200DMA and "close enough" oversold. 3-day recovery good enough for swing trade. #120trade
— Duru A (@DrDuru) Jul. 2 at 06:49 AM
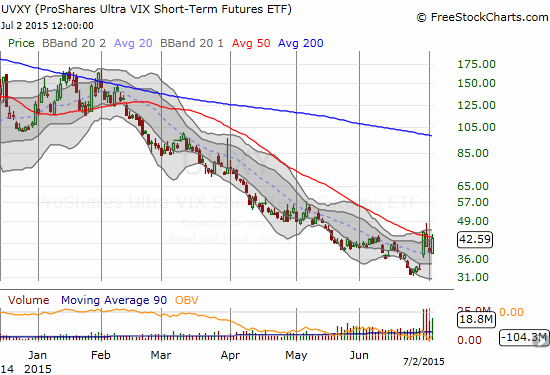
Sold $SSO calls but keeping bet against volatility for now. $UVXY $VXX #120trade
— Duru A (@DrDuru) Jul. 2 at 06:50 AM
With those posts, I closed out the first half of my “oversold enough” trade from the last T2108 Update (for whatever reason, StockTwits did not upload them into my twitter feed). I wanted to hold my call options on ProShares Ultra S&P500 (SSO) longer, but the bounce from the low on Monday was not quite convincing enough. I called the bounce “reluctant” because on each day, sellers were able to fade the index well off the highs. This reluctance was particularly on display on Tuesday and on Thursday. The S&P 500 ended the holiday-shortened week with a stalemate between buyers and sellers: a flat close well off both the highs and the lows of the day.
The SSO gains were modest. I plan to plow that money right back into call options if T2108 hits official oversold conditions (below 20%) and/or volatility spikes to a fresh high.
The fistful of put options on ProShares Ultra VIX Short-Term Futures ETF (UVXY) went through all sorts of gyrations. I felt immediate vindication when UVXY opened on Tuesday with a 10% or so gap down, but volatility rose from there. I felt double vindication on Wednesday when UVXY gapped down yet again and closed on its lows. On Friday, however, UVXY took out its revenge with a picture-perfect bounce of its 20DMA for a 12.6% gain. I took mild solace in the close just below 50DMA resistance.
While I was able to stave off some sense of regret for not locking in profits on Wednesday’s close, I could not shake the sense that I should have tried a counter-trade on UVXY or VXX. I noticed too late that the VIX had bounced cleanly off the good ol’ 15.35 pivot line. This pivot line continue to perform surprisingly well. This was one of those rare moments where it was not front and center for my trading.
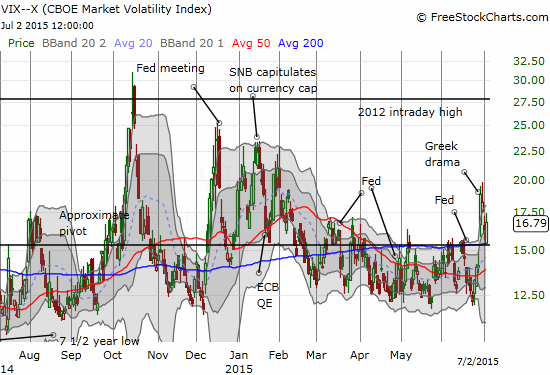
The VIX’s relative resilience since Monday’s surge and UVXY’s surprising divergence in performance with a decline of just 4.2% versus the VIX’s 11% decline combined represent a persistent unease in the market. The coming Greek referendum on the bailout package from the country’s creditors leaves residual uncertainty in the air. I do not think the outcome matters at all to the larger scheme of things for trading. Greece has effectively defaulted, and it has been quite clear for some time that Greece cannot service its debts without a generous restructuring. Only the removal of uncertainty matters. If I am correct, volatility should experience a large plunge next week. At a minimum, UVXY’s out-performance versus the VIX should come to a rapid close with a decline commensurate with the VIX’s performance (it SHOULD move double). The currency markets, for example, are still not flagging any out-sized concerns after Sunday’s initial plunge in the euro (FXE).
China is likely presenting another salient concern for the market. The Shanghai Composite’s (SSEC) breakdown continues. While this index is not representative of the Chinese economy, it does hold a lot of psychological value and is a proxy for the speculative frenzy among retail investors in China. As I demonstrated earlier, the Shanghai Composite is collapsing much like the NASDAQ bubble from 15 years ago.
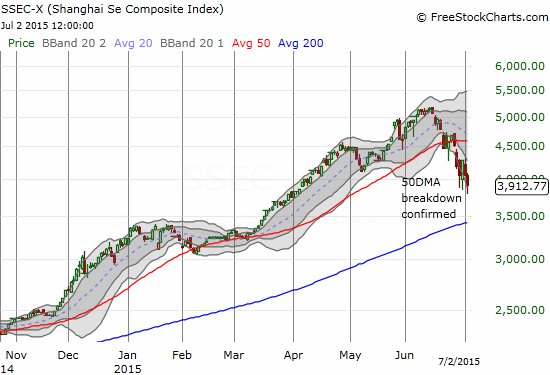
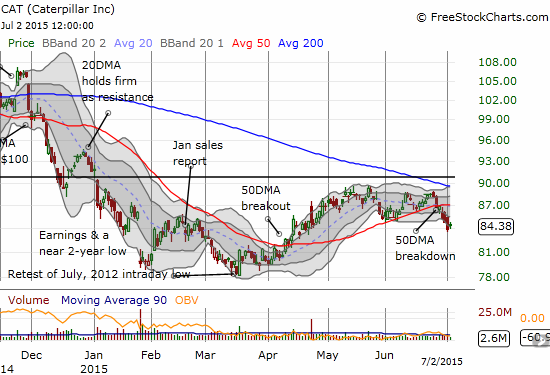
This situation will not likely resolve anytime soon with another rate cut in China failing to stem the losses this time. This trouble reminded me to look at Caterpillar (CAT). As soon as I saw that CAT had broken down below its 50DMA as well as the June low that found support at the 50DMA, I rushed to fade CAT’s meager bounce with a small number of put options. As regular readers know, CAT is my favorite hedge. I really should have been ready with puts a lot earlier – like the day of the breakdown or even the failure to break through recent highs.
Daily T2108 vs the S&P 500
")
Black line: T2108 (measured on the right); Green line: S&P 500 (for comparative purposes)
Red line: T2108 Overbought (70%); Blue line: T2108 Oversold (20%)
Weekly T2108

*All charts created using freestockcharts.com unless otherwise stated
The T2108 Resource Page
Expanded daily chart of T2108 versus the S&P 500
Expanded weekly chart of T2108
Be careful out there!
Full disclosure: long put options on UVXY and CAT, long EUR/JPY