(T2108 measures the percentage of stocks trading above their respective 40-day moving averages [DMAs]. It helps to identify extremes in market sentiment that are likely to reverse. To learn more about it, see my T2108 Resource Page. You can follow real-time T2108 commentary on twitter using the #T2108 hashtag. T2108-related trades and other trades are occasionally posted on twitter using the #120trade hashtag. T2107 measures the percentage of stocks trading above their respective 200DMAs)
T2108 Status: 33.7%
T2107 Status: 46.2%
VIX Status: 15.3
General (Short-term) Trading Call: Neutral with a “wavering bullish bias”
Active T2108 periods: Day #159 over 20%, Day #118 above 30% (overperiod), Day #3 under 40% (underperiod), Day #12 under 50%, Day #29 under 60%, Day #228 under 70%
Reference Charts (click for view of last 6 months from Stockcharts.com):
S&P 500 or SPY
SDS (ProShares UltraShort S&P500)
U.S. Dollar Index (volatility index)
EEM (iShares MSCI Emerging Markets)
VIX (volatility index)
VXX (iPath S&P 500 VIX Short-Term Futures ETN)
EWG (iShares MSCI Germany Index Fund)
CAT (Caterpillar).
Commentary
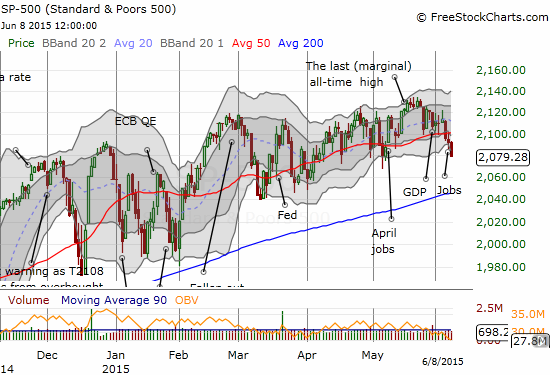
In the last T2108 update, I laid out the case for an imminent bounce in the S&P 500 (SPY) and several other stocks. This is day #1 and counting waiting for this bounce. The S&P 500 sank further below its 50DMA pivot and recorded a feat rare these days: three straight closes below the 50DMA. This last occurrence was in mid-January with 5 straight such closes. Before that was the October plunge which ended with a major oversold print and bounce. In this market of chop, it has become rare for the index to do ANYTHING three straight days, so I am taking wary note.
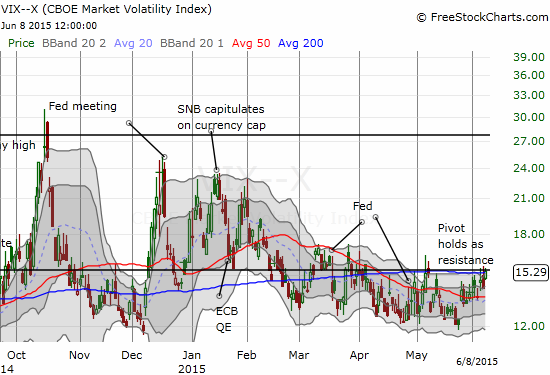
The volatility index still supports a bounce but just marginally. The VIX closed right at the 15.35 pivot with a 15.29 close.
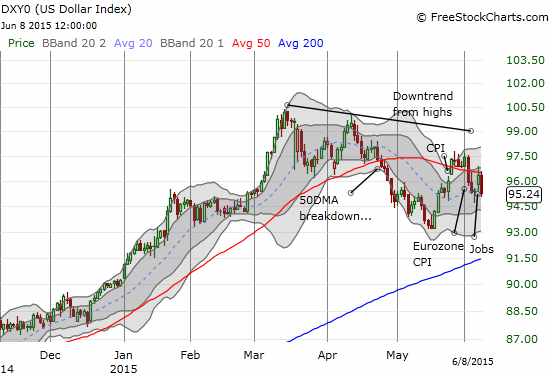
The dollar index (UUP) also fell today, once again defying those who want to draw simple relationships between the dollar and the stock market. The dollar index fell hard enough to reverse all its gains from the strong Friday jobs report. With the S&P 500 and the dollar down since then, the strong data might as well have never happened!
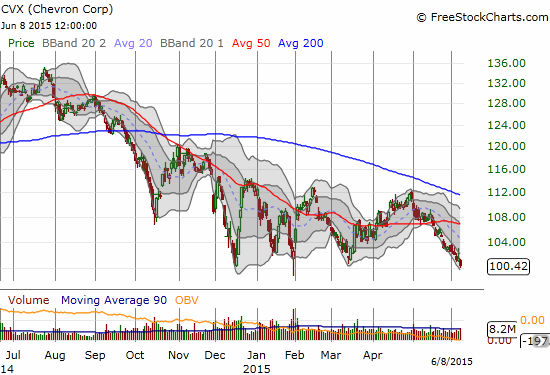
Interestingly, oil did not experience a lift from the dollar’s weakness. Oil closed down on the day so I reviewed a few oil-related names. Chevron (CVX) closed at a three-year closing low. This milestone means that the downward momentum since oil began its crash continues for CVX even as the chart still looks like it contains a 6-month trading range. I nibbled on some CVX on Friday assuming this trading range will hold.
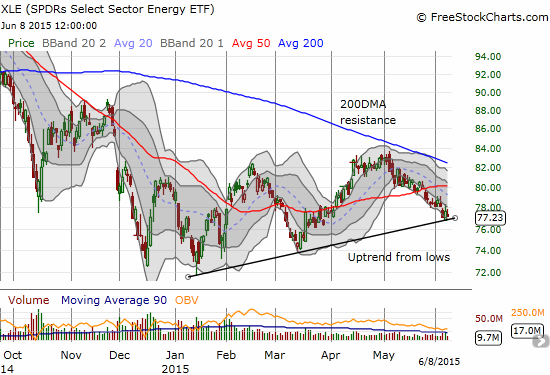
Seeing the fresh weakness in CVX, I turned my gaze to the Energy Select Sector SPDR Fund (XLE). XLE includes CVX as a major holding. Sure enough, XLE is facing a major juncture. It is testing the uptrend line from its lows. If this gives way, I will probably rush to short the United States Oil Fund LP (USO) and/or XLE itself (perhaps there is an excellent pairs trade in here?).
In other trading news, I bought Amazon.com (AMZN) call options given my anticipation of a bounce. AMZN is now at the bottom of a presumed post-earnings trading range. I also bet on a bounce for Netflix (NFLX). Finally, Shake Shack (SHAK) triggered a long trade – I started with a half position since the stock triggered right at the open. Sure enough, SHAK faded, and I bought my other half at a better price.
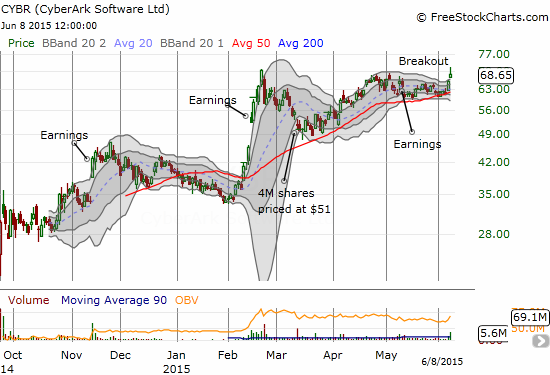
CyberArk Software, Ltd. (CYBR) is the stock I wish I never sold. It broke out briefly today and finally looks ready for new all-time highs.
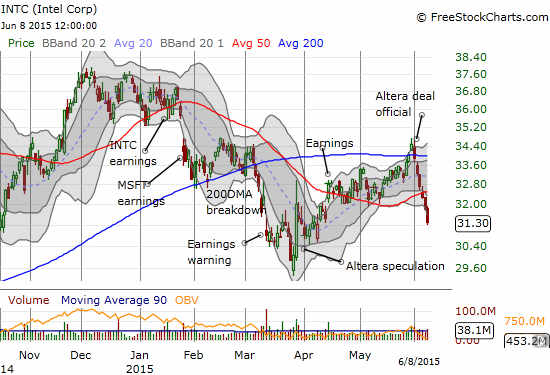
Intel (INTC) is the stock I am salivating to buy, but it continues to sink like a rock. The stock is now getting over-stretched as it trades below its lower-Bollinger Band (BB). One more day of this kind of selling, and I will consider it effectively oversold. However, given the effective resistance around the 200DMA and now the 50DMA breakdown, I will stay patient in waiting for a better entry signal (like a hammer bottom or ANY kind of re-emergence of buying interest!).
Daily T2108 vs the S&P 500

Black line: T2108 (measured on the right); Green line: S&P 500 (for comparative purposes)
Red line: T2108 Overbought (70%); Blue line: T2108 Oversold (20%)
Weekly T2108

*All charts created using freestockcharts.com unless otherwise stated
The T2108 Resource Page
Expanded daily chart of T2108 versus the S&P 500
Expanded weekly chart of T2108
Be careful out there!
Full disclosure: long UVXY call options, long CVX shares, long call options for AMZN and NFLX, long and short various currencies against the U.S. dollar
