
(T2108 measures the percentage of stocks trading above their respective 40-day moving averages [DMAs]. It helps to identify extremes in market sentiment that are likely to reverse. To learn more about it, see my T2108 Resource Page. You can follow real-time T2108 commentary on twitter using the #T2108 hashtag. T2108-related trades and other trades are occasionally posted on twitter using the #120trade hashtag. T2107 measures the percentage of stocks trading above their respective 200DMAs)
T2108 Status: 39.6%
T2107 Status: 47.5%
VIX Status: 13.8
General (Short-term) Trading Call: Neutral
Active T2108 periods: Day #163 over 20%, Day #122 above 30% (overperiod), Day #1 under 40% (underperiod), Day #16 under 50%, Day #33 under 60%, Day #232 under 70%
Reference Charts (click for view of last 6 months from Stockcharts.com):
S&P 500 or SPY
SDS (ProShares UltraShort S&P500)
U.S. Dollar Index (volatility index)
EEM (iShares MSCI Emerging Markets)
VIX (volatility index)
VXX (iPath S&P 500 VIX Short-Term Futures ETN)
EWG (iShares MSCI Germany Index Fund)
CAT (Caterpillar).
Commentary
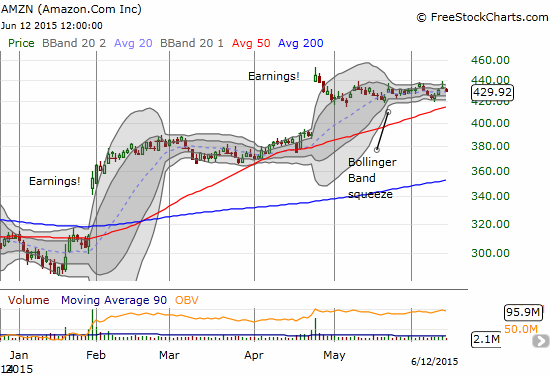
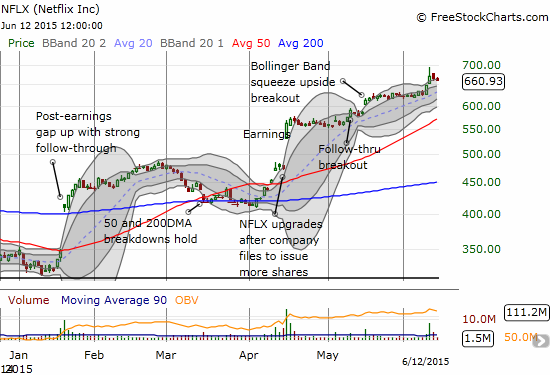
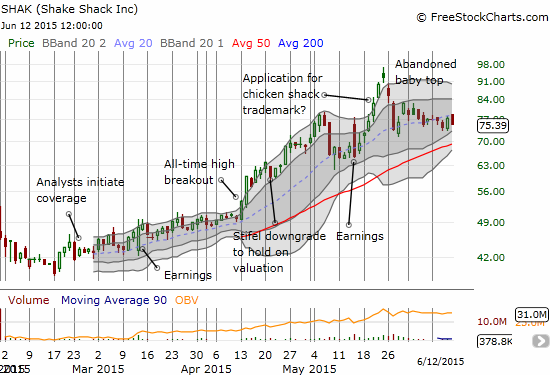
The bounce in the S&P 500 (SPY) that I anticipated finlly materialized on the third trading day from my call. On Day #1, I wrote how the rare extension of selling away from the 50DMA made me waver without eliminating my resolve to play a bounce. I loaded up on call options for Netflix (NFLX) and Amazon (AMZN). I also stuck to bets on Shake Shack (SHAK) and call options on ProShares Ultra S&P500 (SSO). By the end of the week, I was able to lock in satisfactory profits on NFLX and AMZN, watch the SSO calls go marginally green before dipping back into the red, and grit my teeth through SHAK going red, green, and red again. The bounce on the S&P 500 only lasted two days but was launched by the same “small body doji” pattern that I thought would launch a bounce after Friday. As they say, timing is everything!
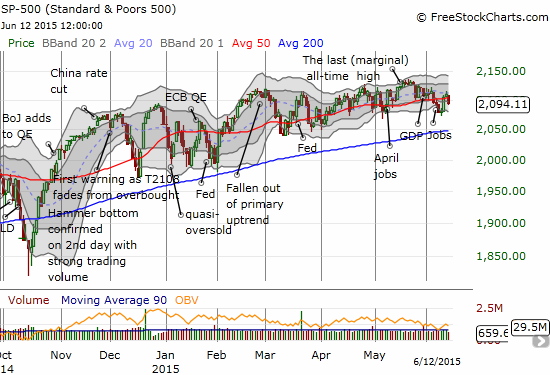
Since February, the S&P 500 has usually sustained breakouts above the 50DMA. The index has spent a lot more time above its 50DMA pivot than below as it has ground and chopped its way higher. Friday’s selling ended just a 2-day span above the 50DMA pivot and maintained a short-term downtrend from the last high (I did not draw the line in the chart). So, if I were to have any bias for the next few days, it would be to the downside…but not by much.
The volatility index behaved as expected for the bounce trade with the 15.35 pivot line delivering solid resistance.
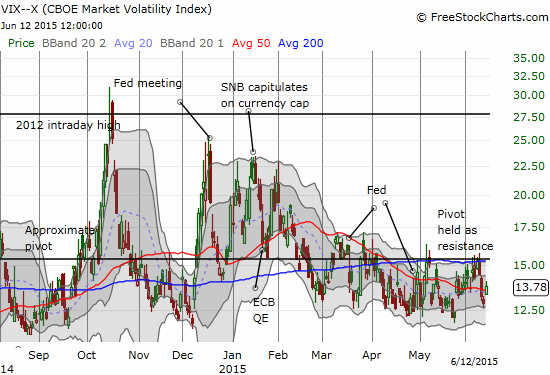
The Federal Reserve makes its next pronouncement on monetary policy on Wednesday, June 17th. The market is essentially a slave to central bank actions, so there is no point in prognosticating ahead of the meeting. However, if the VIX manages to surge above its pivot ahead of the meeting, I will be inclined to fade it. As regular readers know, I maintain an operating assumption that central banks act against volatility despite everything they have said recently trying to warn financial markets about excessively low volatility. Note, I am currently still holding onto an aging call option on ProShares Ultra VIX Short-Term Futures (UVXY) that will not deliver profits without a really big volatility surge from here.
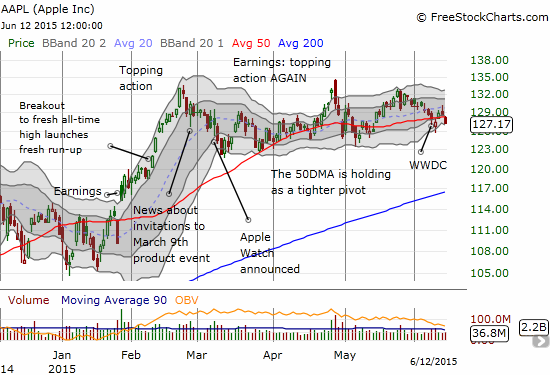
Finally, here are the charts for the most important stocks I traded this past week. A special note on Apple (AAPL): I have not used the Apple Trading Model (ATM) in many weeks because the 50DMA is STILL the main trading theme for the stock.
Daily T2108 vs the S&P 500
")
Black line: T2108 (measured on the right); Green line: S&P 500 (for comparative purposes)
Red line: T2108 Overbought (70%); Blue line: T2108 Oversold (20%)
Weekly T2108

*All charts created using freestockcharts.com unless otherwise stated
The T2108 Resource Page
Expanded daily chart of T2108 versus the S&P 500
Expanded weekly chart of T2108
Be careful out there!
Full disclosure: long UVXY call options, long SHAK, long SSO call options