
(T2108 measures the percentage of stocks trading above their respective 40-day moving averages [DMAs]. It helps to identify extremes in market sentiment that are likely to reverse. To learn more about it, see my T2108 Resource Page. You can follow real-time T2108 commentary on twitter using the #T2108 hashtag. T2108-related trades and other trades are occasionally posted on twitter using the #120trade hashtag. T2107 measures the percentage of stocks trading above their respective 200DMAs)
T2108 Status: 63.8%
T2107 Status: 52.6%
VIX Status: 13.9
General (Short-term) Trading Call: Mildly bearish – STILL waiting to see what happens when/if T2108 becomes overbought. Solidly bearish on a S&P 500 close below 2085.
Active T2108 periods: Day #89 over 20%, Day #48 above 30%, Day #28 over 40%, Day #17 over 60% (overperiod), Day #159 under 70%
Reference Charts (click for view of last 6 months from Stockcharts.com):
S&P 500 or SPY
SDS (ProShares UltraShort S&P500)
U.S. Dollar Index (volatility index)
EEM (iShares MSCI Emerging Markets)
VIX (volatility index)
VXX (iPath S&P 500 VIX Short-Term Futures ETN)
EWG (iShares MSCI Germany Index Fund)
CAT (Caterpillar).
Commentary
And just like that, the market got a reprieve from at least one of the “tentatively ominous” signals I cited in the last T2108 Update: Apple (AAPL).
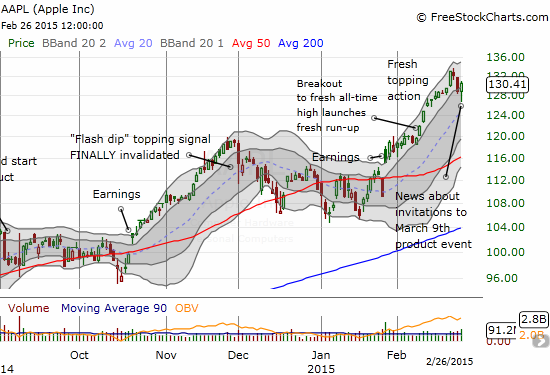
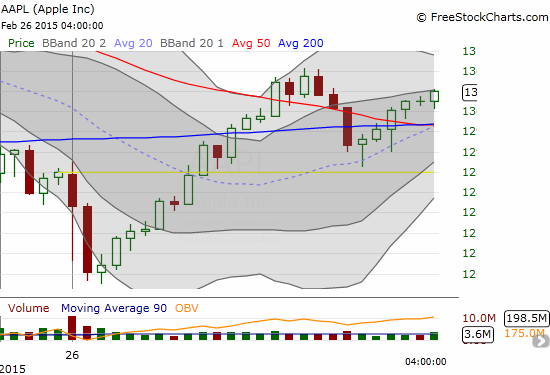
AAPL followed-through on recent selling right at the open. Within 30 minutes it was down as much as 1.7%. That trading action seemed to validate my concern about topping action in AAPL. However, the stock drifted upward from there. Next, news of a product event scheduled for March 9th sealed the deal for a positive day. Interestingly, there was no surge in intraday volume on the news. Surprisingly, looking at the 15-minute chart below, you might never guess anything particularly noteworthy happened after the selling ended.
Regardless of the intraday action, the end result was a very bullish recovery by Apple that sets up the typical “buy the rumor, sell the news cycle” that seems to accompany most Apple product events. This cycle provides the market a reprieve from the warning signs I cited earlier: the anticipation alone for this event should provide plenty of positive and bullish spin for the market.
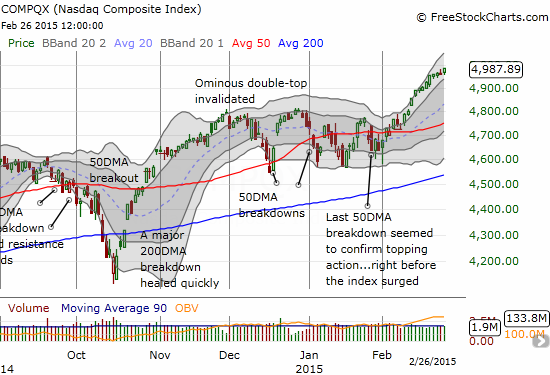
Another positive…the NASDAQ (QQQ) managed a fresh 14+ year high today…this achievement follows 2 days where the NASDAQ seemed unphased by Apple’s brief change of fortune.
On the other side of town, T2108 and the S&P 500 basically are singing the same ol’ refrain. T2108 closed down as I would have expected today. It now sits at 63.8% after a very marginal close lower. The S&P 500 (SPY) also closed marginally lower and still sits comfortably within an uptrend albeit one that now looks like it is waning relative to the NASDAQ.
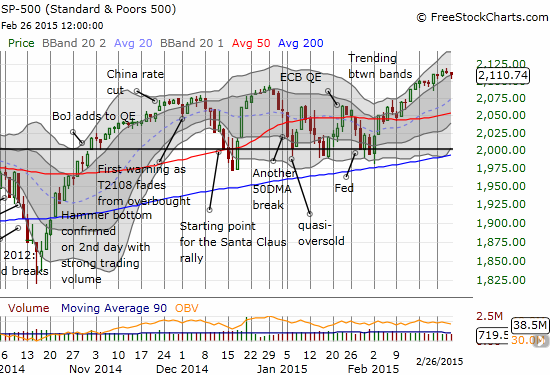
In other words, it seems no dramatic visit into overbought territory or a fast drop away from the boundary is in the cards in the very short-term. I will now retreat from anticipating to mere watching again! Let’s see what March and the beginning of Spring bring.
We know what my favorite permabear is looking forward to… 🙂
Coming up on RealMoneyPro shortly – Why I want to go "all in" short now and what is preventing me from doing so. $SPY
— Douglas Kass (@DougKass) February 26, 2015
Daily T2108 vs the S&P 500
")
Black line: T2108 (measured on the right); Green line: S&P 500 (for comparative purposes)
Red line: T2108 Overbought (70%); Blue line: T2108 Oversold (20%)
Weekly T2108

*All charts created using freestockcharts.com unless otherwise stated
The T2108 Resource Page
Expanded daily chart of T2108 versus the S&P 500
Expanded weekly chart of T2108
Be careful out there!
Full disclosure: long AAPL call and put options