
(T2108 measures the percentage of stocks trading above their respective 40-day moving averages [DMAs]. It helps to identify extremes in market sentiment that are likely to reverse. To learn more about it, see my T2108 Resource Page. You can follow real-time T2108 commentary on twitter using the #T2108 hashtag. T2108-related trades and other trades are posted on twitter using the #120trade hashtag)
T2108 Status: 69.0% (ending 3 days in overbought conditions)
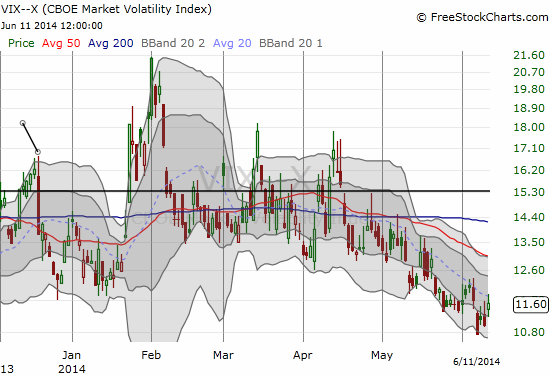
VIX Status: 11.6
General (Short-term) Trading Call: Hold
Active T2108 periods: Day #234 over 20%, Day #86 over 40%, Day #13 over 60% (overperiod), Day #1 under 70% (underperiod)
Reference Charts (click for view of last 6 months from Stockcharts.com):
S&P 500 or SPY
SDS (ProShares UltraShort S&P500)
U.S. Dollar Index (volatility index)
EEM (iShares MSCI Emerging Markets)
VIX (volatility index)
VXX (iPath S&P 500 VIX Short-Term Futures ETN)
EWG (iShares MSCI Germany Index Fund)
CAT (Caterpillar).
Commentary
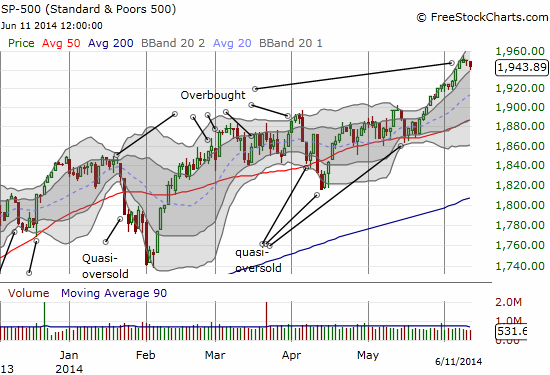
Last week, I recommended that both bears and bulls brace themselves for this summer’s trading. So of course the overbought period that triggered my warning ends in just three days (just under the median duration of 4 days) with a notable whimper.
The S&P 500 has no sign of topping and even sits firmly within its primary uptrend defined by the first and second Bollinger Bands (BBs). For trend followers, this is a spot for buying.
The volatility index, the VIX, is off its post-recession lows. The bounce is fairly unspirited.
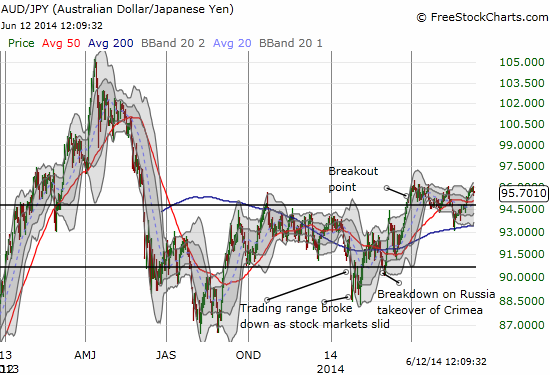
The Australian dollar weakened ever so slightly. This confirmed general market weakness, but the currency is hardly breaking down.
These signals all add up to intrigue but no rush to act. Bears do not have enough weakness here to justify a trade, or at least one with a good risk/reward. Bulls can swing trade on the uptrend; short-term expectations should be muted.
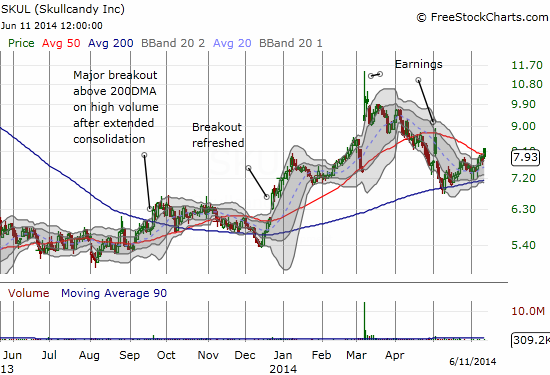
While we wait for some firmer resolution, here is an interesting chart of Skullcandy (SKUL). Today it marginally broke above its 50-day moving average (DMA) and stayed faithful to its 200DMA support. I have covered this company and its prospects in several posts. Slowly but surely the healing progresses.
Daily T2108 vs the S&P 500
")
Black line: T2108 (measured on the right); Green line: S&P 500 (for comparative purposes)
Red line: T2108 Overbought (70%); Blue line: T2108 Oversold (20%)
Weekly T2108

*All charts created using freestockcharts.com unless otherwise stated
Related links:
The T2108 Resource Page
Expanded daily chart of T2108 versus the S&P 500
Expanded weekly chart of T2108
Be careful out there!
Full disclosure: long SKUL