
(T2108 measures the percentage of stocks trading above their respective 40-day moving averages [DMAs]. It helps to identify extremes in market sentiment that are likely to reverse. To learn more about it, see my T2108 Resource Page. You can follow real-time T2108 commentary on twitter using the #T2108 hashtag. T2108-related trades and other trades are posted on twitter using the #120trade hashtag)
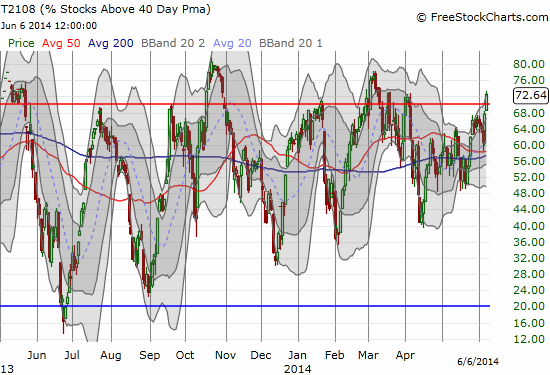
T2108 Status: 72.6%
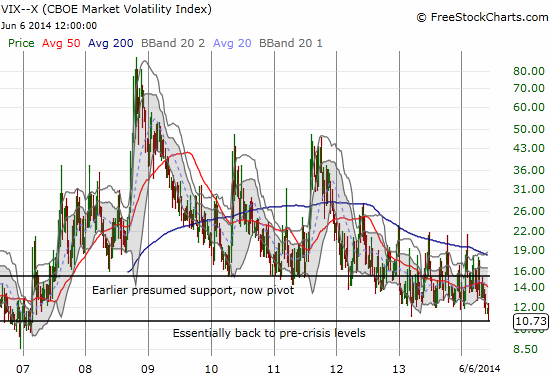
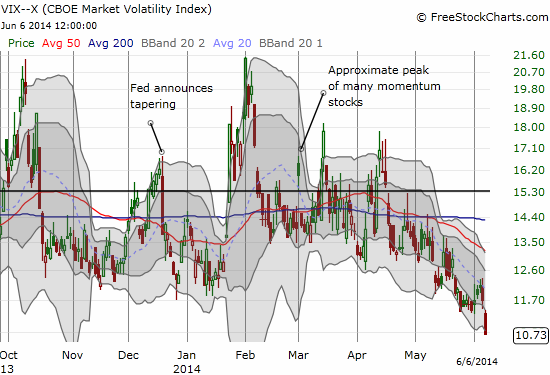
VIX Status: 10.7
General (Short-term) Trading Call: Buy (hopefully on whatever dips the market provides) to follow uptrend of extended overbought rally; Short ONLY on confirmed weakness (see below)
Active T2108 periods: Day #231 over 20%, Day #83 over 40%, Day #10 over 60%, Day #1 over 70% (over-period/overbought)
Reference Charts (click for view of last 6 months from Stockcharts.com):
S&P 500 or SPY
SDS (ProShares UltraShort S&P500)
U.S. Dollar Index (volatility index)
EEM (iShares MSCI Emerging Markets)
VIX (volatility index)
VXX (iPath S&P 500 VIX Short-Term Futures ETN)
EWG (iShares MSCI Germany Index Fund)
CAT (Caterpillar).
Commentary
After a two-month hiatus, T2108 is overbought again. I cannot imagine a more treacherous time to attain such heights – bears AND bulls will need to brace themselves. Let’s flip through the story in charts…
T2108 made a convincing punch into overbought territory to begin what I think should be an extended run in overbought territory. For those brave enough to play or continue playing the trend, note that T2108 has spent a maximum of ten trading days in overbought territory since it was last in oversold territory (an eternity ago in June, 2013).
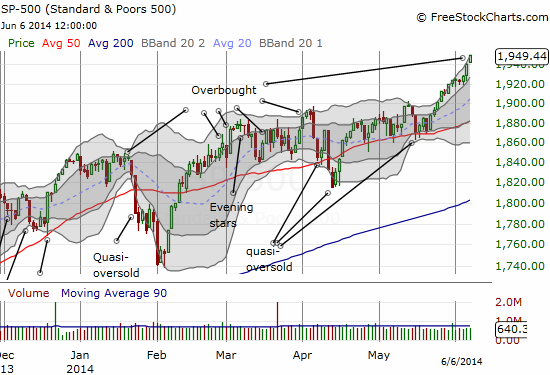
The S&P 500 (SPY) is putting on an impressive upward run. Worries about the January barometer and “sell in May” have been swept away into a crumpled heap and have taught a hard lesson to those who blindly follow market adages without context or the REAL data at their fingertips. I have written several pieces on both adages to demonstrate with data the much more complicated stories. This move has taught a hard lesson to people who eschew technicals for fundamentals, insisting that “global growth is slowing,” “China is about to collapse and take the planet with it” or “stocks are expensive by XYZ metric.” Clearly, there are still plenty of buyers who think differently and/or do not care. Or even more likely, the sellers are just simply exhausted from fighting the trend for so long. And of course this breakout is a reminder of the limits of the T2108 framework. It remains a technical indicator that speaks loudest at extremes and not so much in between. (Fortunately, I have been able to use other tools in between during chart reviews of individual stocks).
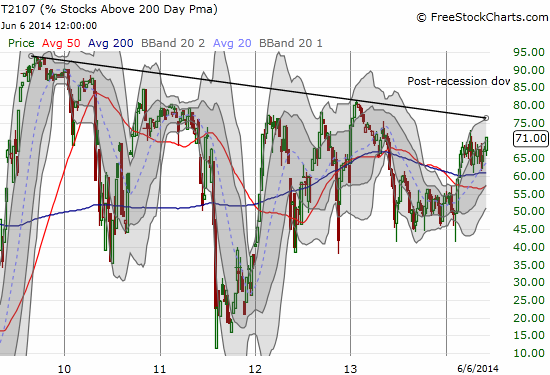
Amazingly, for all the historic bullishness on display, T2107 – the percentage of stocks trading above their respective 200DMAs – is STILL trapped under a post-recession downtrend. As a reminder, this means that the strong uptrends have been led by an elite group of stocks. A crowd is allowed to gather around these elite, but with each passing year the maximum capacity has declined overall. If/when this downtrend breaks, it may turn into the ultimate sell signal, a time when maximum buying power is finally applied to the market. At the tail end of the last bull market, T2107 produced a breakout from a multi-year downtrend. The S&P 500 topped out a year later. If this is an indicator it is NOT a fast-acting indicator by any means. The context for any breakout will be important.
The ultra-low level of the VIX, the volatility index, makes this overbought period particularly treacherous. I have become a broken record on this point because I think it is an important caveat. Things appear placid now, but when the calm finally breaks (and it WILL at some point!), the downward convulsions could be particularly abrupt, severe, and deep. If this kind of move lays out there in the future, then put options are particularly cheap right now.
I think market-watchers generally still believe/assume that the summertime is a period when traders take time off and stop paying attention to the market. Such a break may have been more true before technology allowed everyone to watch the market in real-time and trade accordingly. NOW, anyone who has paid attention in the last several years and more should know better. Government interventions in the market have provided a particularly powerful focal point for summertime churn. Indeed, the data suggest that the summer is full of trading opportunities. For example, you can review “Summer’s Positive Gains Can Come With High Risks” which I wrote three years ago. With the European Central Bank (ECB) further easing monetary policy at the same time the Federal Reserve reduces its bond buying to zero, I cannot help but assume that this summer will deliver some notable fireworks.
So, bears should brace themselves: the market could seriously rip higher this summer. Bulls should brace themselves: the end of this run could deliver some serious pain for anyone unprepared (no, I am NOT calling for a major market crash). In between, I hope to stand vigilant by the tea leaves: disbelief safely tucked away in that closet I talked about in the last T2108 Update, caution in the holster, and emotions and presumptions on lockdown.
The trading strategy is two-fold, pick your combination of poisons. On the bullish side, play the (remaining) uptrend for all that its worth as long as T2108 is overbought. Hopefully, dips will be notable enough to provide good risk/reward opportunities for swing trading. On the bearish side, the time to short will only be on confirmed weakness. The market may exhibit weakness in two main forms: 1) a blow-off top featuring a surge in buying volume along with a parabolic type move, ideally well above the upper Bollinger Band, and/or 2) a drop from overbought status. If the S&P 500 rallies over, say 5%, during this overbought period, the definition of a breakdown into weakness may get some adjustment. Stay tuned!
Daily T2108 vs the S&P 500
")
Black line: T2108 (measured on the right); Green line: S&P 500 (for comparative purposes)
Red line: T2108 Overbought (70%); Blue line: T2108 Oversold (20%)
Weekly T2108

*All charts created using freestockcharts.com unless otherwise stated
Related links:
The T2108 Resource Page
Expanded daily chart of T2108 versus the S&P 500
Expanded weekly chart of T2108
Be careful out there!
Full disclosure: no positions