(T2108 measures the percentage of stocks trading above their respective 40-day moving averages [DMAs]. It helps to identify extremes in market sentiment that are likely to reverse. To learn more about it, see my T2108 Resource Page. You can follow real-time T2108 commentary on twitter using the #T2108 hashtag. T2108-related trades and other trades are posted on twitter using the #120trade hashtag)
T2108 Status: 67.9%
VIX Status: 15.6 (a drop of 12.2%)
General (Short-term) Trading Call: Short (fade rallies)
Active T2108 periods: Day #175 over 20%, Day #21 over 60%, Day #4 under 70% (underperiod)
Reference Charts (click for view of last 6 months from Stockcharts.com):
S&P 500 or SPY
SDS (ProShares UltraShort S&P500)
U.S. Dollar Index (volatility index)
EEM (iShares MSCI Emerging Markets)
VIX (volatility index)
VXX (iPath S&P 500 VIX Short-Term Futures ETN)
EWG (iShares MSCI Germany Index Fund)
CAT (Caterpillar).
Commentary
The market is not dead yet.
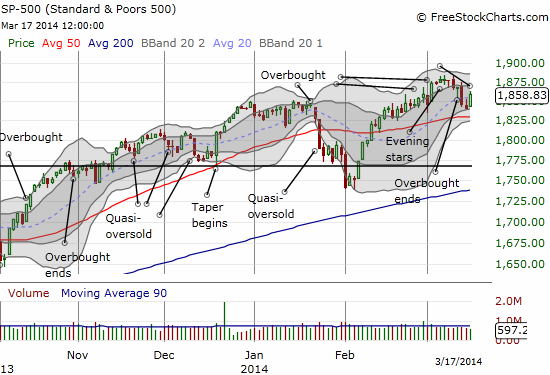
T2108 enjoyed a healthy rebound today to 67.9%, already under the nose of overbought conditions all over again. The S&P 500 (SPY) almost gained 1% in a display that demonstrated buyers are not nearly as exhausted as I thought.

The volatility index, the VIX, got smashed, falling 12.2% to 15.6. Yes, you guessed it, the VIX tagged the 15.35 pivot perfectly at its low for the day. This abrupt drop in volatility reminded me how effective it should be to hedge my ProShares Ultra S&P 500 (SSO) puts with puts to fade ProShares Ultra VIX Short-Term Fut ETF (UVXY). What seems to be developing is a propensity for volatility to hop, skip, and jump all over the place. If so, swing traders should get prepared for ever shorter holding times for trades.
Per rule and the current trading call, I faded today’s rally by doubling down on my SSO puts. I piled on by buying a fresh tranche of UVXY shares, just a small number of course. I believe I scored a minor moral victory by closing the day flat on those shares. With the Federal Reserve on tap along with chair Janet Yellen publicly speaking this Wednesday, anything can happen with the market this week. I am expecting a good swing in either direction that should allow me at least one small window to get out with some profit with better risk/reward than the last round with UVXY shares. I will then go back to fading volatility according to regularly scheduled programming (this time as a hedge as stated above).
Quick follow-up on Friday’s chart reviews:
- Successful bounces off support: Google (GOOG), First Solar (FSLR)
- Lacking sell follow-through: Facebook (FB) {bounced perfectly off lower-Bollinger Band), International Business Machines (IBM) {rallied straight into 200DMA resistance}
- Failed bounce off support: Starbucks (SBUX)
- Failed support: Herbalife (HLF) {it’s getting even uglier!}
Daily T2108 vs the S&P 500

Black line: T2108 (measured on the right); Green line: S&P 500 (for comparative purposes)
Red line: T2108 Overbought (70%); Blue line: T2108 Oversold (20%)
Weekly T2108

*All charts created using freestockcharts.com unless otherwise stated
Related links:
The T2108 Resource Page
Expanded daily chart of T2108 versus the S&P 500
Expanded weekly chart of T2108
Be careful out there!
Full disclosure: long SSO puts and calls, long UVXY shares; short FB and long calls; short GOOG and long calls; short SBUX
