
(T2108 measures the percentage of stocks trading above their respective 40-day moving averages [DMAs]. It helps to identify extremes in market sentiment that are likely to reverse. To learn more about it, see my T2108 Resource Page. You can follow real-time T2108 commentary on twitter using the #T2108 hashtag. T2108-related trades and other trades are posted on twitter using the #120trade hashtag)
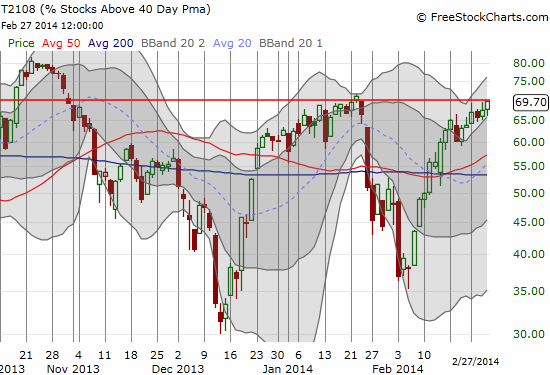
T2108 Status: 69.7% (closed at the high of the day)
VIX Status: 14.0
General (Short-term) Trading Call: Short (bearish bias)
Active T2108 periods: Day #163 over 20%, Day #12 over 50%, Day #9 over 60% (overperiod), Day #25 under 70%
Reference Charts (click for view of last 6 months from Stockcharts.com):
S&P 500 or SPY
SDS (ProShares UltraShort S&P500)
U.S. Dollar Index (volatility index)
EEM (iShares MSCI Emerging Markets)
VIX (volatility index)
VXX (iPath S&P 500 VIX Short-Term Futures ETN)
EWG (iShares MSCI Germany Index Fund)
CAT (Caterpillar).
Commentary
At least I can round up and call this market overbought.
T2108 continues to tease. A third close call in four days brought T2108 within 0.3 percentage points of overbought status. To complete the tantalizing creep, my favorite technical indicator closed at its highs of the day as well.
Meanwhile, the S&P 500 (SPY) achieved a fresh closing all-time high. The stars are now lining up for a monster breakout. The timing would be too perfect if it happened on the first trading day of the new month (March) which will also be the beginning of the week. However, I am waiting until I see the whites of the eyes of the next bullish run before I hop aboard. So, I am maintaining the bearish bias. Although I am NOT opening any new tranches of SSO puts, I am remaining mindful of what happened the last time T2108 notched overbought status and fell out of bed the very next day.
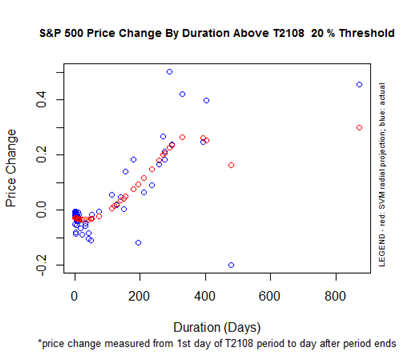
Speaking of monster breakouts, this is also a good time to look at what the T2108 overperiods are telling us. Most importantly, the 20% overperiod (the duration of time T2108 has spent above 20% – below which it is oversold) has lasted an amazing 163 days. T2108 was last oversold on June 25, 2013. The S&P 500 closed at 1588.03 that day. The S&P 500 has blazed higher by 16.8% since then. The chart below shows that very few 20% overperiods have ended with these gains. However, the overperiod has entered a breakout phase – meaning that the longer T2108 stays out of trouble (above 20%), the more likely the S&P 500 will retain significant gains by the time it reaches oversold again. This is an important point to remember if/when the S&P 500 breaks out into an extended overbought period!
Quick updates on yesterday’s chart reviews…
First Solar (FSLR) surged another 8.4%, almost closing its post-earnings gap down already. It is firmly back in bullish territory, and I am royally kicking myself for not being ready to pounce today! (It probably does not help that my overall trading bias remains bearish!)
Ebay (EBAY) has broken out. It even closed at a 9+ year high. The run-up from here could happen quickly. Thankfully, I did NOT miss this move.
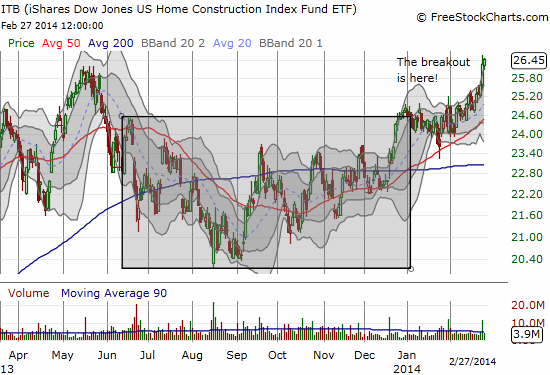
And a final note on the market’s tone. One area I have remained stubbornly bullish for the last several years is housing, home builder stocks in particular. The breakout I called several months ago appears to be finally underway. I find it EXTREMELY difficult to stay bearish at all seeing home builders breakout. If home builders run-up with the S&P 500, I will definitely get fully on board an aggressive, extended overbought rally. Stay tuned!
(Those of you familiar with bullish cup and handle technical patterns will see the sheer poetry in this chart. Very nice).
Daily T2108 vs the S&P 500
")
Black line: T2108 (measured on the right); Green line: S&P 500 (for comparative purposes)
Red line: T2108 Overbought (70%); Blue line: T2108 Oversold (20%)
Weekly T2108

*All charts created using freestockcharts.com unless otherwise stated
Related links:
The T2108 Resource Page
Expanded daily chart of T2108 versus the S&P 500
Expanded weekly chart of T2108
Be careful out there!
Full disclosure: long SSO puts, long EBAY call spread