
(T2108 measures the percentage of stocks trading above their respective 40-day moving averages [DMAs]. It helps to identify extremes in market sentiment that are likely to reverse. To learn more about it, see my T2108 Resource Page. You can follow real-time T2108 commentary on twitter using the #T2108 hashtag. T2108-related trades and other trades are posted on twitter using the #120trade hashtag)
T2108 Status: 67.5% (69.4% at today’s high!)
VIX Status: 14.4
General (Short-term) Trading Call: Short (bearish bias)
Active T2108 periods: Day #162 over 20%, Day #11 over 50%, Day #8 over 60% (overperiod), Day #24 under 70%
Reference Charts (click for view of last 6 months from Stockcharts.com):
S&P 500 or SPY
SDS (ProShares UltraShort S&P500)
U.S. Dollar Index (volatility index)
EEM (iShares MSCI Emerging Markets)
VIX (volatility index)
VXX (iPath S&P 500 VIX Short-Term Futures ETN)
EWG (iShares MSCI Germany Index Fund)
CAT (Caterpillar).
Commentary
T2108 is creeping ever so slowly higher. Today’s 67.5% close is a fraction of a percentage point higher than Monday’s close call with overbought conditions. Today’s high is essentially the same as Monday’s high. Close call #2.
The S&P 500 (SPY) closed almost exactly flat. The VIX edged up slightly higher. Overall, a very dull day while we continue to wait for some kind of resolution for this close brush with overbought conditions.
As usual, there are plenty of charts of individual stocks that are delivering plenty of excitement. I cover several here: BlackBerry (BBRY), First Solar (FSLR), Ebay (EBAY), Starbucks (SBUX), Tesla Motors (TSLA), and LinkedIn (LNKD).
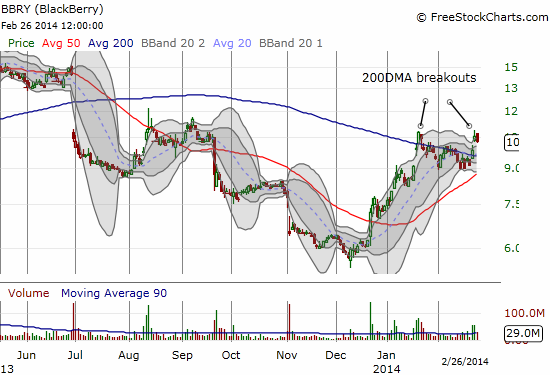
BBRY made a second breakout above its 200-day moving average (DMA) as it continues to struggle to recover from last summer’s gap down. BBRY has been amazingly resilient all things considered. BBRY now offers a clear trading opportunity to the long side with a stop below the 200DMA.
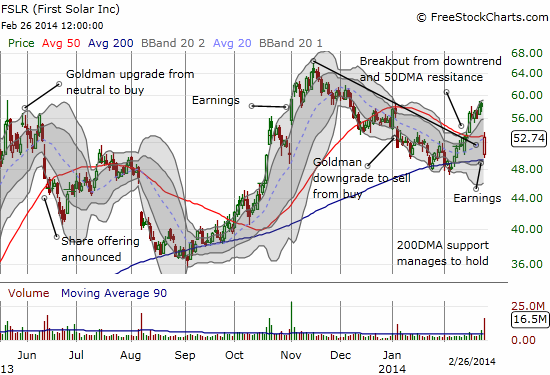
First Solar (FSLR) reported earnings yesterday and the response was initially poor with a drop as large as 11% or so. As bad as this drop seemed, it only reversed a significant breakout from the earlier downtrend. That breakout was tradeable to the long side with high risk of holding through earnings. Now, FSLR’s stock is stuck neatly between the 50DMA and 200DMA. A trade with a confirmed breakout or breakdown is very likely to deliver a sustained swing trade at a minimum. And yes, I placed those markers for Goldman Sachs research calls on purpose! 🙂
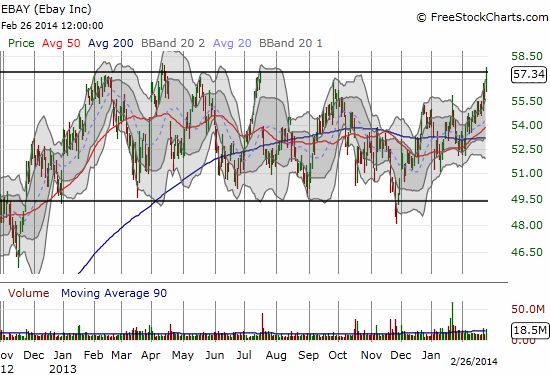
EBAY has been stuck in a wide trading range since the end of 2012. Today, the stock traded to the top of the trading range for the first time since last summer. I am on breakout-watch especially given Carl Icahn’s recent involvement in this stock!
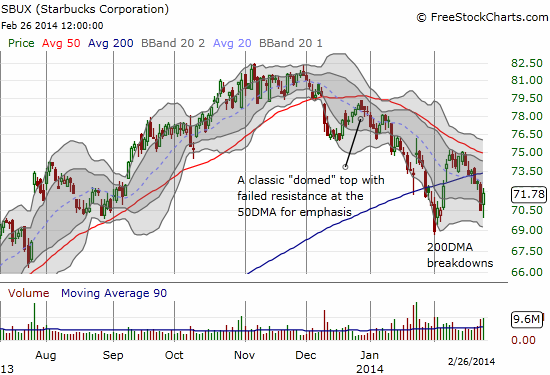
SBUX has been a classic short since forming a domed pattern that included a breakdown below the 50DMA and a confirmation of 50DMA as resistance shortly afterward. In late January, SBUX punched through 200DMA support for the first time since late 2012. The stock quickly recovered only to drop below the 200DMA again as the now downtrending 50DMA helped cap the deadcat bounce. Today, SBUX looked ready to confirm a new phase of its gradual sell-off, but buyers stepped in at the magic round number of $70. Thick resistance looms above if SBUX tries to push higher, but it is also notable that the stock has made a higher low upon the appearance of buyers. Watch the beahvior around key technicals very closely on this one!
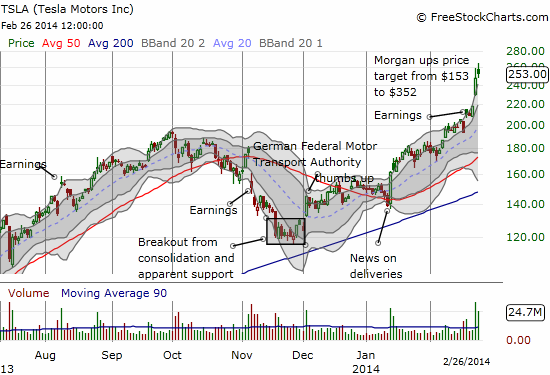
It is RARE to see an analyst double a price target on a stock. Morgan Stanley (MS) did just that yesterday (February 25th) to TSLA. The move sent the stock soaring about 16% in a move that looks nearly parabolic. Despite already closing above the upper-Bollinger Band (BB), today, TSLA still moved even higher and closed higher even with a fade in between. I wish I could read Morgan’s analyst report; I guess the analyst(s) felt left far behind after the stock failed to completely collapse post-earnings. Then again, we find out in after hours tonight that Morgan is sponsoring a convertible note offering! Great work pumping the stock higher to get better pricing on the deal? Who knows. But the stock traded even higher in after hours after this announcement. TSLA has definitely become the bane of the bears. It is acting like destiny is in its favor…
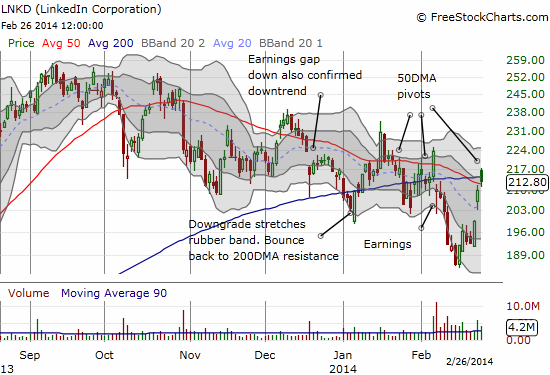
Yesterday, LNKD in popped about 5% on new old news about entry into China. The stock stopped short of resistance of the 50DMA. As in previous episodes, LNKD managed to power right through the next day, gapping up and even trading through its 200DMA temporarily. I was fortunate enough to still be holding onto a weekly call option that expired this Friday, and I sold it yesterday. Given my suspicion that LNKD would continue its recent trading patterns, I did not switch to shorting the stock right away (as I have done a bit early in scaling into shorts before!). Instead, I changed tactics and plowed the profits into a March monthly put option and an April monthly call spread. While today’s action seems to confirm my bias and assumption that LNKD will soon sell-off again, I am starting to think that this regular pattern should end soon. If the slide is coming to an end, a powerful rally could be on the way; the call spread positions me well to wait out the churn higher. If LNKD sells off on schedule, I can profit quickly on the put option and see whether the regularly scheduled rebound can happen in time to fortuitously profit on the call spread as well. Stay tuned!
Daily T2108 vs the S&P 500
")
Black line: T2108 (measured on the right); Green line: S&P 500 (for comparative purposes)
Red line: T2108 Overbought (70%); Blue line: T2108 Oversold (20%)
Weekly T2108

*All charts created using freestockcharts.com unless otherwise stated
Related links:
The T2108 Resource Page
Expanded daily chart of T2108 versus the S&P 500
Expanded weekly chart of T2108
Be careful out there!
Full disclosure: long SSO puts, long EBAY call spread, short SBUX