(This is an excerpt from an article I originally published on Seeking Alpha on January 16, 2014. Click here to read the entire piece.)
On December 1, 2013, I wrote a piece called “A Potentially Low Risk Pairs Trade Opportunity Using The S&P 500” where I used PowerShares S&P 500 Low Volatility (SPLV) and PowerShares S&P 500 High Beta (SPHB) to form a pairs trade against the S&P 500 (SPY). Since then, SPHB has further extended its recent outperformance versus SPLV and SPY. SPHB is up 4.0%. SPLV is exactly even. SPY is up 2.0%.
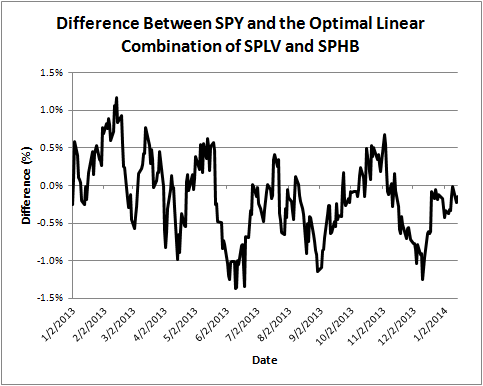
Even more importantly, the pairs trade has performed exactly as I could have hoped (although I threw in a twist I will explain soon). The following graph shows that the difference between SPY and the optimal linear combination of SPLV and SPHB approached the bottom of its recent range and triggered a trade going long SPHB and SPLV in the ratio 2.57/3.24 respectively versus short 1 SPY as described and calculated in the previous piece. The trigger occurred on December 11, 2013 and in a month’s time, the combination has reverted to flatline, returning a little over 1% in gains. (In good news for the potential sustainability of this pairs trade, my recalibration of the ratio using all of 2013 data produced almost identical parameters.)

Source for price data: FreeStockCharts.com
{snip}
I am also taking some cues from Joe Duran, CEO of United Capital Financial Advisers who appeared on Nightly Business Report on January 3, 2014 (at 4:00 in the video broadcast). Duran has a bullish forecast for the economy in 2014 but is still on the lookout for a sizeable correction.
{snip}
In this case, I like being positioned in puts on the short side of the pairs trade. The relative protection/profits grow the steeper the correction gets. Timing will be everything of course. {snip}
Be careful out there!
(This is an excerpt from an article I originally published on Seeking Alpha on January 16, 2014. Click here to read the entire piece.)
Full disclosure: long SPLV, SPHB, SSO puts
