
(T2108 measures the percentage of stocks trading above their respective 40-day moving averages [DMAs]. It helps to identify extremes in market sentiment that are likely to reverse. To learn more about it, see my T2108 Resource Page. You can follow real-time T2108 commentary on twitter using the #T2108 hashtag. T2108-related trades and other trades are posted on twitter using the #120trade hashtag)
T2108 Status: 51.6%
VIX Status: 15.9
General (Short-term) Trading Call: Short (bearish bias) but for now still playing bounce from quasi oversold conditions
Active T2108 periods: Day #142 over 20%, Day #27 over 40%, Day #1 over 50% (overperiod), Day #3 under 60% (underperiod), Day #4 under 70%
Reference Charts (click for view of last 6 months from Stockcharts.com):
S&P 500 or SPY
SDS (ProShares UltraShort S&P500)
U.S. Dollar Index (volatility index)
EEM (iShares MSCI Emerging Markets)
VIX (volatility index)
VXX (iPath S&P 500 VIX Short-Term Futures ETN)
EWG (iShares MSCI Germany Index Fund)
CAT (Caterpillar).
Commentary
The S&P 500 finally bounced out of quasi-oversold conditions with a 0.61% gain on the day. It was a reluctant bounce as the index closed just barely kissing the lower-Bollinger Band (BB). This move was barely enough to roll back Monday’s losses.
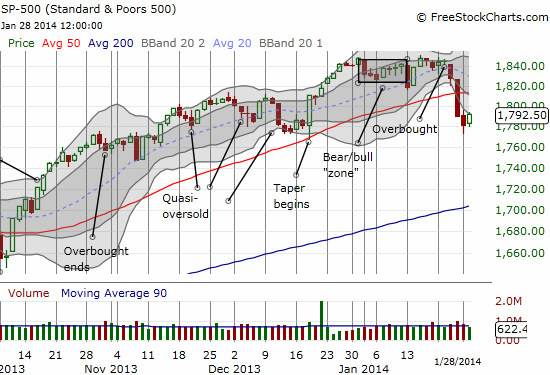
Other moves were more dramatic. T2108 soared 6 percentage points to 51.6%, providing a slightly better indicator for the rush to buy the “bargains” of the day. The volatility index, the VIX, plunged again. This time it lost 9.3% and closed just above the 15.35 pivot point.
As I tweeted near the market’s close, I decided to switch my quasi-oversold strategy outlined in the last T2108 Update. I sold my put options in iPath S&P 500 VIX ST Futures ETN (VXX) and decided to keep holding the SSO calls. After a twitter conversation with a trader, I realized that my confidence in a post-Fed volatility flattening did not respect the distinct possibility that volatility could soar going into or in the immediate wake of the Fed decision. By locking in profits here, I can now fade the next volatility spike with confidence. The SSO calls are barely profitable right now; I need to keep them in case the bounce from quasi-oversold conditions continues unabated.
Assuming the rally has a little more legs, bears get two more shots at fading the market: S&P 500 at 1800 and at the 50DMA around 1813; I prefer the 50DMA. Given the strong primary uptrend in the index, traders have to assume that a fresh close above the 50DMA will signal a high likelihood of a continuation of the rally. At that point, I go right back to “overbought watch.”
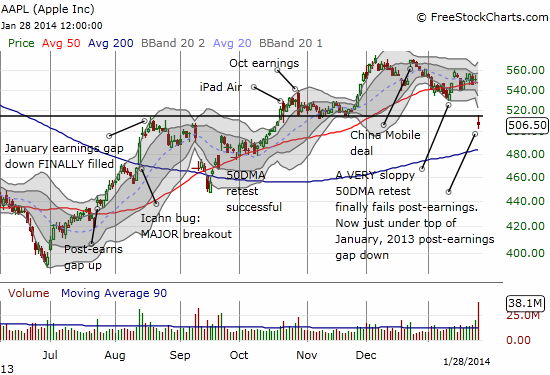
I close with a quick post-earnings look at the latest disaster at Apple (AAPL). My bearish pre-earnings call on AAPL turned out correct, but I did not even come close to predicting such a steep fall. In fact, I implored traders to stay conservative!
I now have an in-the-money 535/525 put spread expiring next Friday. I would like to get full value for it, and I think I can wait out expiration. Just in case, I bought a weekly $525 call option expiring next week that will lock in profits if I get caught napping on a sudden surge in AAPL (unlikely); this assumes such a surge does not happen in the last day or two before expiration. This is actually my second tour with this call. After AAPL gapped so far down below its lower-BB, I waited for an opportunity to fade the gap (regular readers should know the post-earnings fade routine by now). I was pleasantly surprised when the stock started a relief rally soon after I put on my position. Soon it occurred to me that I should watch behavior at the top of the January, 2013 gap. Sure enough, AAPL stalled right there (poetry in charts!), and I quickly sent my call option out to pasture. The profits from this trade paid for most of repurchase of the same call when AAPL (re)faded toward its lows on the day.
Going forward, I will be trading off the Apple Trading Model (ATM) again. No prediction for tomorrow given Tuesday was such a special day. Well, since you asked anyway, the prediction is 81% odds for upside tomorrow. 50/50 chance of upside from the open.
Daily T2108 vs the S&P 500
")
Black line: T2108 (measured on the right); Green line: S&P 500 (for comparative purposes)
Red line: T2108 Overbought (70%); Blue line: T2108 Oversold (20%)
Weekly T2108

*All charts created using freestockcharts.com unless otherwise stated
Related links:
The T2108 Resource Page
Expanded daily chart of T2108 versus the S&P 500
Expanded weekly chart of T2108
Be careful out there!
Full disclosure: long SPHB and SPLV and SSO puts; bearish bias on the Australian dollar and Japanese yen (still long AUD/JPY for now); long VXX shares