
(T2108 measures the percentage of stocks trading above their respective 40-day moving averages [DMAs]. It helps to identify extremes in market sentiment that are likely to reverse. To learn more about it, see my T2108 Resource Page. You can follow real-time T2108 commentary on twitter using the #T2108 hashtag. T2108-related trades and other trades are posted on twitter using the #120trade hashtag)
T2108 Status: 45.3% (Got as low as 42.9%)
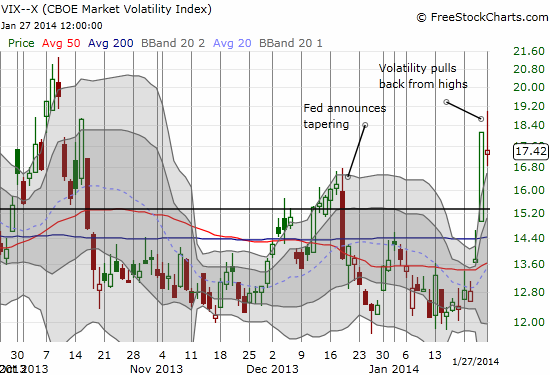
VIX Status: 17.4
General (Short-term) Trading Call: Short (bearish bias) but see below for caveats
Active T2108 periods: Day #141 over 20%, Day #26 over 40% (overperiod) (50% overperiod ended at 23 days), Day #3 under 70%
Reference Charts (click for view of last 6 months from Stockcharts.com):
S&P 500 or SPY
SDS (ProShares UltraShort S&P500)
U.S. Dollar Index (volatility index)
EEM (iShares MSCI Emerging Markets)
VIX (volatility index)
VXX (iPath S&P 500 VIX Short-Term Futures ETN)
EWG (iShares MSCI Germany Index Fund)
CAT (Caterpillar).
Commentary
Despite quasi-oversold conditions that produced 86% odds for upside on Monday, the S&P 500 (SPY) stretched further to the downside and remained well below its lower-Bollinger Band.
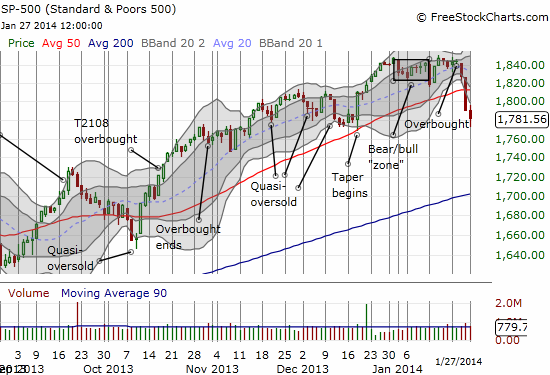
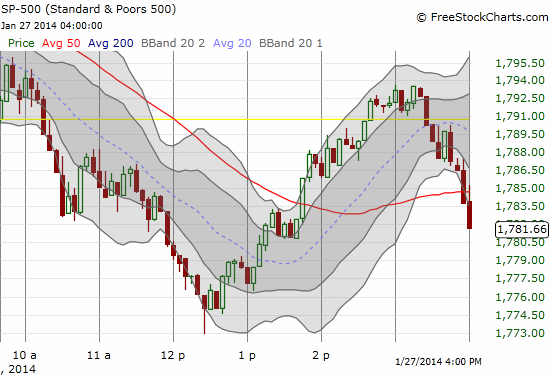
This continued show of strength by sellers sent T2108 down as a low as 42.9% before settling at 45.3%. Given my expectations for a bounce from quasi-oversold conditions, I used the morning’s selling to purchase a small tranche of call options on ProShares Ultra S&P500 (SSO). For good measure I doubled down on my put options on iPath S&P 500 VIX ST Futures ETN (VXX). When the market bottomed exactly at noon Eastern, I felt like a genius. However, the weak close flattened out my brief profits on the SSO calls. I maintained profits on the second tranche of VXX puts because the pullback in the VIX was so large that not even the weak close could get the VIX back to flatline.
With T2108 losing another 5.7 percentage points, the market goes into its second day of quasi-oversold conditions. This time, the T2108 Trading Model (TTM) projection for upside is even stronger than the 86% for Monday: a whopping 100%! The classification error remains way too high but at 47% it makes a lot more sense than the 53% for Monday’s projection. The straight, historical error rate is around 22%. Think about the difference this way: if I tried to apply the model blindly to ANY 2-day decline, I should expect a 50/50 chance of getting an upside prediction correct. However, if I ONLY apply this model to these specific quasi-oversold conditions, then I have much better odds of being correct. Based on the quasi-oversold predictions over the past year, I am inclined to go with the historical error rate as a sufficient measure of performance. I still hope to get time in the near future to tinker with the model to reduce the classification error (I also still think there is a problem in the way the classification error is calculated for this algorithm).
Regardless, I like the prediction for Tuesday much better than the one for Monday. First, it aligns with the tendency of the S&P 500 to trade up on Tuesday (see the last T2108 Update for more details) as opposed to its tendency to trade down on Mondays. Second, the model output is a simpler classification tree with the following rules: the 1-day T2108 change less than -8.9% and a T2108 close above 38.8%. Note there is now no dependency on the VIX level. There were 11 of 138 cases of this setup in the historical data (stretching back to 1986).
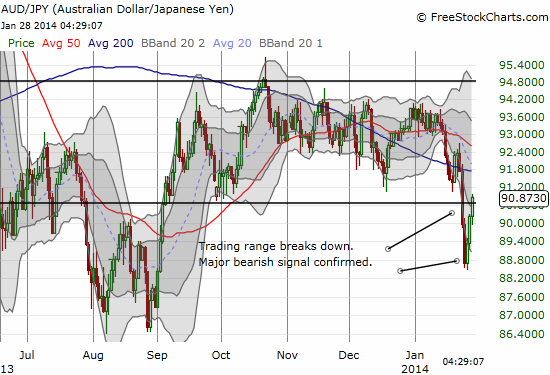
If the S&P 500 rallies on Tuesday, I will be looking to sell my SSO calls. I will hold the VXX puts at least one more day since I still expect the trading post-Fed on Wednesday to smash volatility. As I type, a continued rally in AUD/JPY seems to further support my expectation for a strong open on Tuesday. The important currency pair is above support again. Clearly, though, the breakdown was a much stronger and more immediate signal than the current bounce.
The overall trading call remains bearish given the tumble began from overbought conditions. The trading call will change to hold/neutral if/once the S&P 500 closes above its 50DMA. The trading call switches to bullish if T2108 hits true oversold conditions (20% or lower).
I close with some trading and chart updates.
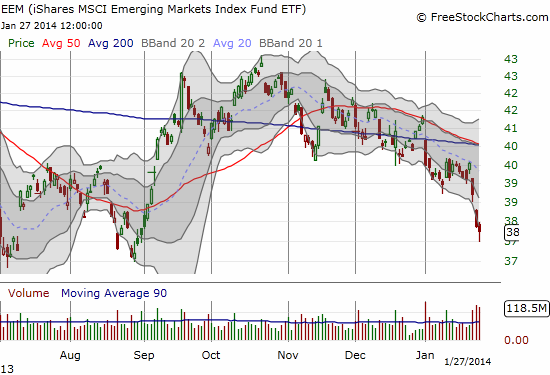
iShares MSCI Emerging Markets (EEM)
EEM is now one of my favorite strangle/straddle plays. EEM is VERY sensitive to both positive and negative catalysts, producing sharp moves in a given direction. I think there is little to no point in anticipating when these happen and prefer to just be positioned for whatever happens. In this latest case, I neglected to point out the trade triggered again (sorry!), but I was also late in recognizing the opportunity. I set it up on Friday with an overweight on puts. With EEM managing to extend losses on Monday, I took profits on the puts and am riding house money on the calls. I will reload on the puts if EEM rallies from here. A retest of the rapidly declining 20DMA would be ideal. Note how above that, the 50 and 200DMAs have converged.
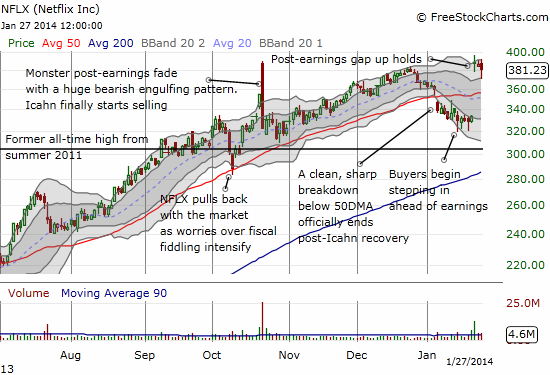
Netflix (NFLX)
It seems crazy, but I remain VERY bullish on NFLX. See earlier posts for more details. NFLX punched through the post-earnigns low, but I had no intention of shorting. Instead, I bought shares again. The trade took longer than 30 minutes this time – after I got 10 points, I sent the shares back out to pasture. I will stay focused on buying dips, and I hope I will be properly positioned for what I think will soon be a fresh run-up.
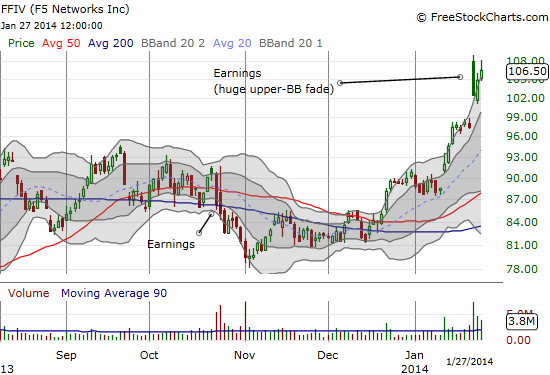
F5 Networks, Inc. (FFIV)
I missed this trade. I was eying a tag of the upper-BB, but my buy order for call options never executed. FFIV is another post-earnings trade that has potential. It has to close at a fresh post-earnings high though to convince me it can sustain a rally.
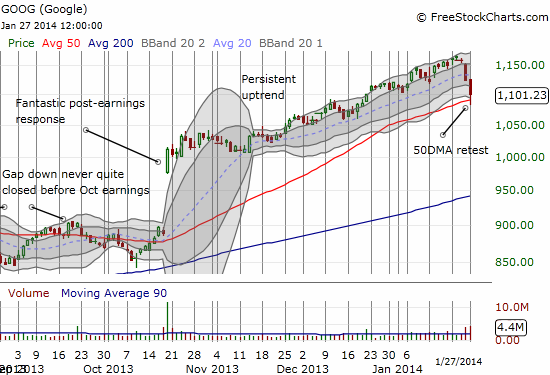
Google (GOOG)
GOOG plunged again on Monday. This time for a 2% loss. It retested the 50DMA and managed to rally well off its lows. Earnings are coming up this week. It looks to me GOOG has explosive potential – upside or downside – as it seems a bunch of investors are eager to cash out ahead of earnings. The primary uptrend has broken (between the the two Bollinger Bands). It is now up to the 50DMA to keep the rally going.
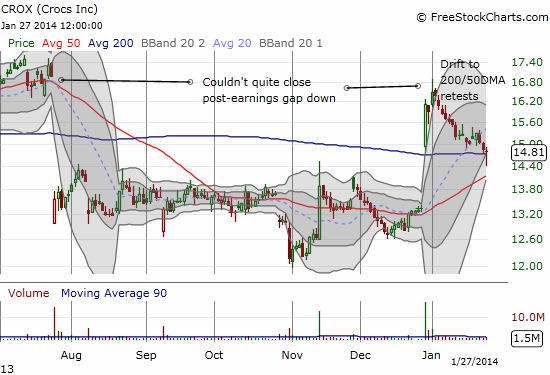
Crocs (CROX)
This trade is not quite working out as I had planned. I was hoping for at least 20DMA support after the stock popped up big, but it only slowed the trickle downward in value for the stock. Monday looks like a good enough retest of the 200DMA, but this lack of momentum means the 50DMA is likely getting a retest before firm support shows up. All the gains post gap up are now reversed.
Daily T2108 vs the S&P 500
")
Black line: T2108 (measured on the right); Green line: S&P 500 (for comparative purposes)
Red line: T2108 Overbought (70%); Blue line: T2108 Oversold (20%)
Weekly T2108

*All charts created using freestockcharts.com unless otherwise stated
Related links:
The T2108 Resource Page
Expanded daily chart of T2108 versus the S&P 500
Expanded weekly chart of T2108
Be careful out there!
Full disclosure: long SPHB and SPLV and SSO puts; bearish bias on the Australian dollar and Japanese yen (still long AUD/JPY for now); long VXX shares and puts; long CROX shares and calls