The start of 2014’s first full week of trading did not disappoint. There were fireworks to be found in all sorts of individual stocks. I am only covering three in this chart review: Twitter (TWTR), Apple (AAPL), and LinkedIn (LNKD).
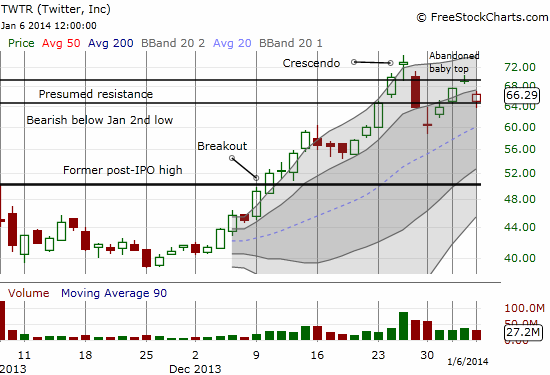
TWTR gapped down on Monday (January 6, 2014) forming a more definitive formation of the dreaded abandoned baby top. The formation on the day of TWTR’s crescendo was a close call. While I believe this move confirms the top in TWTR, I have to caveat with an observation from the options trading pit. I purchased put options on TWTR on Friday as it ran into, and struggled with, what I earlier mapped out as likely resistance at the $69 level. Those options nearly doubled instantly at the open. BUT, even as the stock trickled down a little further, the value of the puts immediately melted downward and never returned to the highs. That should have been my signal to just bail on the trade. TWTR closed the day on a positive note with a small recovery from the lows, finding neat support at the line in the sand I drew earlier dividing bears and bulls. See the chart below.

So, TWTR is at another critical juncture. My bias is that follow-through selling is on its way. However, it may not come soon enough for my puts to return to that brief padding of profit. If TWTR moves higher from here and invalidates the abandoned baby top, say a close above $71, look out. Such a move would be VERY bullish and likely signal engines revving up for another TWTR run-up. For traders, this is NOT a time to quibble with “silly notions” like fundamentals and valuation. This is a case where the market mainly cares about momentum. Follow it for now…a bullish TWTR easily hits $100 in no time.
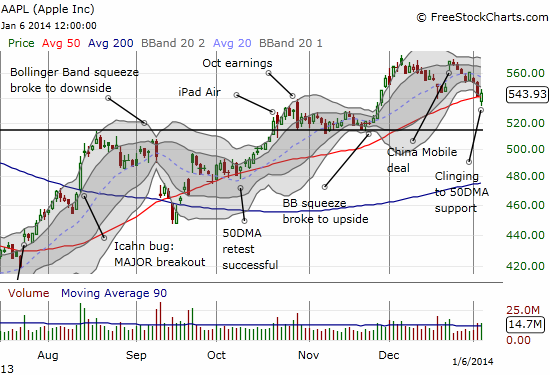
AAPL wasted no time in creating a sloppy retest of its 50-day moving average (DMA). I covered the scenarios in my last T2108 Update. In that post, I noted that the Apple Trading Model (ATM) projected high odds of a negative close for Monday’s trading but that the model was unstable. So it seems appropriate that AAPL first gapped down significantly below its 50DMA, stretching well below the lower-Bollinger Band (BB), before bouncing right back to close ABOVE the 50DMA. This erratic behavior might be explained by market makers (and the like) taking out a wall of stops below the 50DMA and then proceeding to run up the stock to profit from the shares opportunistically nabbed at lower prices. Unfortunately, this scenario did not occur to me until it was far too late to jump into the feeding frenzy at or around the day’s lows.
This retest is not as sloppy as September’s (yet). However, we have been put on notice that AAPL’s short-term downtrend (starting from the gap up on the China Moble (CHL) news) is confirmed with the odds favoring an extension of the downtrend. It was good to see AAPL manage a close above the 50DMA, but I doubt it will hold…at least not without some positive (and new) catalyst. Such a spark may not come until January earnings at this point. Note those prospects get all the more interesting with news that brutal competition from Apple at the high-end in China is likely to rile up Samsung – see “Samsung Electronics braces for weakest year of smartphone growth.”
The ATM projects 84% odds for a down day on Tuesday on the same unstable branch of the model that created the forecast for Monday. Look out then for more intraday fireworks!

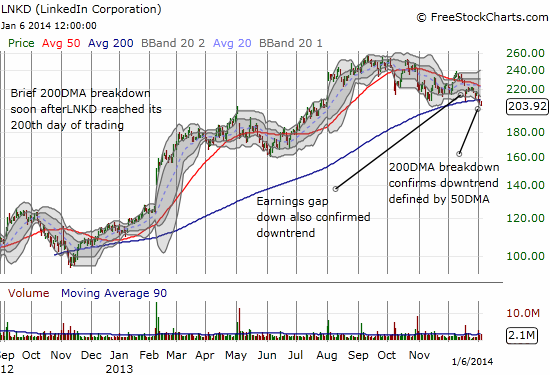
LNKD has broken below its 200DMA for the first time since the stock hit its 200th day of trading. The technicals here are very plain and simple. LNKD has broken down and the onus is on the bulls and buyers to prove that the stock is not headed even lower. Bears and shorts can load up with stops either above the 200DMA or, for more aggressively pessimistic folks, stops above the downtrending 50DMA.

Source for charts: FreeStockCharts.com
Be careful out there!
Full disclosure: long AAPL shares, calls, and puts; long TWTR puts
