
(T2108 measures the percentage of stocks trading above their respective 40-day moving averages [DMAs]. It helps to identify extremes in market sentiment that are likely to reverse. To learn more about it, see my T2108 Resource Page. You can follow real-time T2108 commentary on twitter using the #T2108 hashtag. T2108-related trades and other trades are posted on twitter using the #120trade hashtag)
T2108 Status: 47.5%
VIX Status: 13.5
General (Short-term) Trading Call: Aggressive traders should have taken profits or stopped out with S&P 500 climbing over 1800.
Active T2108 periods: Day #114 over 20% (overperiod), Day #5 under 50%, Day #22 under 60%, Day #27 under 70%
Reference Charts (click for view of last 6 months from Stockcharts.com):
S&P 500 or SPY
SDS (ProShares UltraShort S&P500)
U.S. Dollar Index (volatility index)
EEM (iShares MSCI Emerging Markets)
VIX (volatility index)
VXX (iPath S&P 500 VIX Short-Term Futures ETN)
EWG (iShares MSCI Germany Index Fund)
CAT (Caterpillar)
Commentary
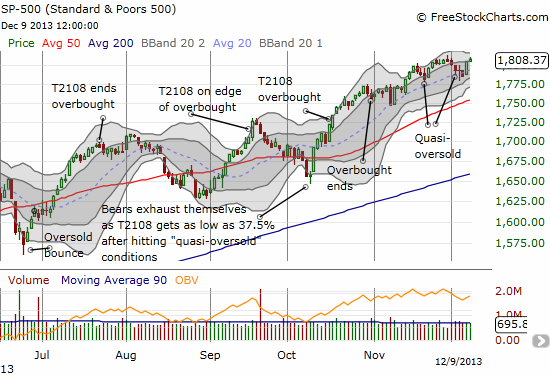
Another new all-time closing high and another demonstration of the inability of sellers to sustain substantial pressure on the market. As I had hoped and expected, Friday’s employment reported provided some notable resolution to the market’s likely next direction. A strong report did not bring out tapering fears. Interest rates actually declined slightly while the S&P 500 jumped out of quasi-oversold conditions and surged over the 1800 mark. These quasi-oversold conditions developed in the wake of Black Friday (and generated a detour from what could have otherwise provided an earlier bullish signal).
On Friday, I tweeted that the trading action seemed to confirm an upside resolution, especially given the accompanying surge in T2108. I quickly moved into a first tranche of ProShares Ultra S&P 500 (SSO) call options. I targeted expiration for December 21st, after the next Fed meeting. If these do not generate profits, I will likely move into SSO shares and sit on them until/unless the S&P 500 drops below 1800 again.
Other than some gyrations that should net to nothing as the market passes through next week’s Federal Reserve meeting (December 19th), I think trading will be pretty boring through the end of the year. I do not expect then to write much more about T2108 for a while (although rest assured I will stay on alert). I hope to use this “break” to get some other long overdue writing finished. One thing at top of mind is the sudden weakness in solar stocks. I also remain steadfastly bullish for housing and still see a consolidation underway that should lead to a fresh rally in 2014 (absent fresh shocks to the economy). I plan on fine-tuning my writing on this sector. Toll Brothers (TOL) reports Tuesday morning…
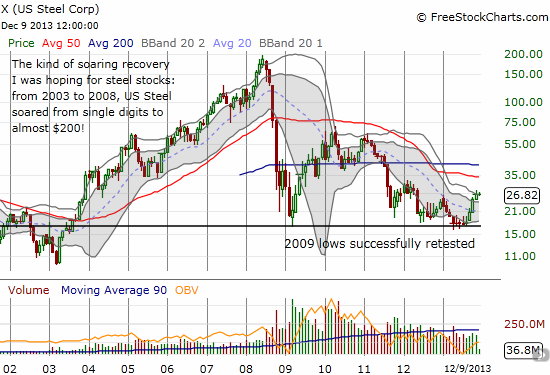
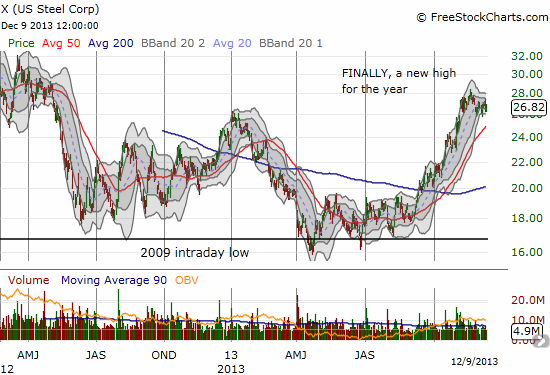
One area that I have neglected bigtime this year is steel, a sector I used to a follow much more closely before this year. I went quiet as things headed south and quietly accumulated more of US Steel (X). The stock seemed not to reflect all the good things going on in the automobile industry. The stock is barely up for the year but has come a long way from the bottom. One of those classic cases of buying low as the stock amazingly retested the lows from 2009. AK Steel (AKS) is my big disappointment in the sector and I chose NOT to accumulate it this year. The stock sliced through its 2009 lows earlier this year but it has bounced with other steel stocks to double off the lows. I hope to get back on the case for steel in 2014. In the meantime, see the daily and monthly charts below for U.S. Steel.
Daily T2108 vs the S&P 500
")
Black line: T2108 (measured on the right); Green line: S&P 500 (for comparative purposes)
Red line: T2108 Overbought (70%); Blue line: T2108 Oversold (20%)
Weekly T2108

*All charts created using freestockcharts.com unless otherwise stated
Related links:
The T2108 Resource Page
Expanded daily chart of T2108 versus the S&P 500
Expanded weekly chart of T2108
Be careful out there!
Full disclosure: long SSO puts and calls, long X and AKS