
(T2108 measures the percentage of stocks trading above their respective 40-day moving averages [DMAs]. It helps to identify extremes in market sentiment that are likely to reverse. To learn more about it, see my T2108 Resource Page. You can follow real-time T2108 commentary on twitter using the #T2108 hashtag. T2108-related trades and other trades are posted on twitter using the #120trade hashtag)
T2108 Status: 68.2% (ends a 10-day overbought period)
VIX Status: 12.9 (surprisingly flat)
General (Short-term) Trading Call: Stay short.
Active T2108 periods: Day #90 over 20% (overperiod), Day #3 under 70%
Reference Charts (click for view of last 6 months from Stockcharts.com):
S&P 500 or SPY
SDS (ProShares UltraShort S&P500)
U.S. Dollar Index (volatility index)
EEM (iShares MSCI Emerging Markets)
VIX (volatility index)
VXX (iPath S&P 500 VIX Short-Term Futures ETN)
EWG (iShares MSCI Germany Index Fund)
CAT (Caterpillar)
Commentary
In the last T2108 Update, I declared that the potential for an extended overbought rally had ended. T2108 dropped below the 70% overbought threshold and history demonstrates that such a drop tends to presage a notable sell-off for the S&P 500 (SPY). Friday’s weak start to the month seemed to confirm the downside risk; for a good while, it seemed that the month would even fail to start with an upside trading day. This second day of trading for the month delivered small follow-through buying, and T2108 is back to scratching at overbought levels.
If T2108 returns again to overbought levels, I will have to start the clock all over. My ProShares Ultra S&P 500 (SSO) puts would then be very likely to expire next week worthless. However, I will also be far away from replacing (or hedging) them with SSO calls. In other words, a return to overbought levels would likely usher in a pretty quiet month of (T2108) trading for me.
The next big milestone is post-Black Friday trading. Amazingly enough, the bullish setup from 2012 remains intact….and 2011’s bullish signal seems like it will be safe for years to come! I will write an update on this trade in the next week or so.
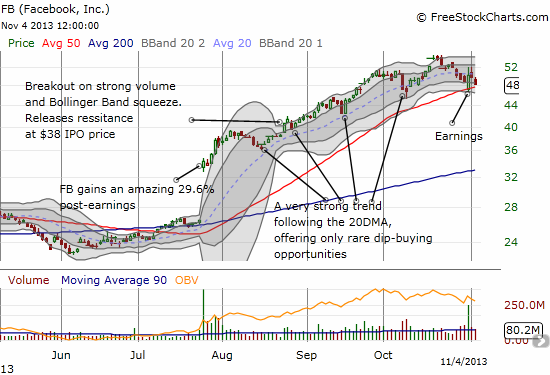
I end with my chart of the day: Facebook (FB). This chart seems timely with the IPO of Twitter (TWTR) coming up this Thursday (Nov 7th). FB made a valiant attempt to recover from a post-earnings dip to 50DMA support. Sellers have quickly returned the last two days, perhaps cashing in to prepare to buy TWTR shares, sending FB close to another retest of support. As the lower-Bollinger Band begins to turn downward, I doubt this retest will succeed. Just in case, I bought another round of FB calls to hedge my on-going short position. Last week’s earnings demonstrated exactly what I talked about earlier to justify my short position: at any time, at any earnings call, the company can and will disappoint extremely high expectations.
Daily T2108 vs the S&P 500
")
Black line: T2108 (measured on the right); Green line: S&P 500 (for comparative purposes)
Red line: T2108 Overbought (70%); Blue line: T2108 Oversold (20%)
Weekly T2108

*All charts created using freestockcharts.com unless otherwise stated
Related links:
The T2108 Resource Page
Expanded daily chart of T2108 versus the S&P 500
Expanded weekly chart of T2108
Be careful out there!
Full disclosure: long SSO puts, short FB shares, long FB puts