
(T2108 measures the percentage of stocks trading above their respective 40-day moving averages [DMAs]. It helps to identify extremes in market sentiment that are likely to reverse. To learn more about it, see my T2108 Resource Page. You can follow real-time T2108 commentary on twitter using the #T2108 hashtag. T2108-related trades and other trades are posted on twitter using the #120trade hashtag)
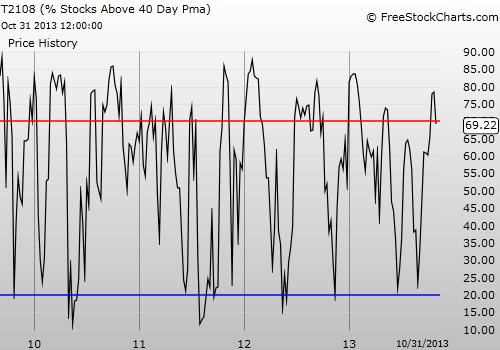
T2108 Status: 69.2% (ends a 10-day overbought period)
VIX Status: 13.8 (surprisingly flat)
General (Short-term) Trading Call: Short.
Active T2108 periods: Day #88 over 20% (overperiod), Day #1 under 70%
Reference Charts (click for view of last 6 months from Stockcharts.com):
S&P 500 or SPY
SDS (ProShares UltraShort S&P500)
U.S. Dollar Index (volatility index)
EEM (iShares MSCI Emerging Markets)
VIX (volatility index)
VXX (iPath S&P 500 VIX Short-Term Futures ETN)
EWG (iShares MSCI Germany Index Fund)
CAT (Caterpillar)
Commentary
An extended overbought rally looms no longer. Today, T2108 cracked the 70% overbought threshold to the downside and ended the last overbought period at 10 days. If an extended overbought rally is still in the cards, we will not see it until Thanksgiving or so.
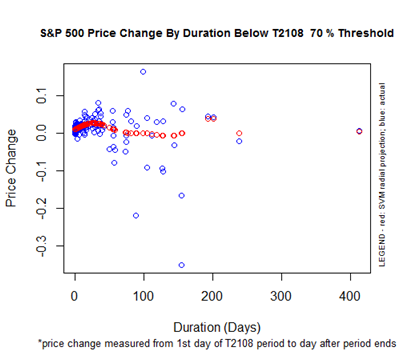
As long as T2108 remains below 70%, the odds of a significant sell-off loom much larger than an extended overbought rally. The weekly chart below reminds us that in recent years T2108 has tended to experience significant downside, along with the S&P 500 (SPY), after an overbought period ends.
In the past, I have failed to note this relationship. Not this time! While the stock market has entered a seasonally strong period, I take this signal very seriously.
In the last T2108 Update I recommended that traders short if they do not yet have shorts in place because the S&P 500 was at the top of the expected range of performance. I also wrote that the end of the overbought period is one potential signal to short the index. The S&P 500 ended the overbought period with a 1.3% gain which is more in line with expectations.
The 70% underperiod is intriguing. The market has a strong bias for upside if the 70% underperiod ends in the next 20 or 30 days. But absent an expectation for such a quick return, I am comfortable staying short here.
The one caveat/surprise is the volatility index (VIX). It barely budged again. I would have expected more of a jump from such low levels if downside risks had increased materially.
A second caveat is that Friday begins a new month. As we know, months tend to begin with notable gains. If the month begins with a nice jump, shorts will get a better entry point, T2108 will jump back into overbought territory, and I will have to reset the clock on a fresh overbought period. Stay tuned!
Daily T2108 vs the S&P 500
")
Black line: T2108 (measured on the right); Green line: S&P 500 (for comparative purposes)
Red line: T2108 Overbought (70%); Blue line: T2108 Oversold (20%)
Weekly T2108

*All charts created using freestockcharts.com unless otherwise stated
Related links:
The T2108 Resource Page
Expanded daily chart of T2108 versus the S&P 500
Expanded weekly chart of T2108
Be careful out there!
Full disclosure: long SSO puts, net long U.S. dollar