
(T2108 measures the percentage of stocks trading above their respective 40-day moving averages [DMAs]. It helps to identify extremes in market sentiment that are likely to reverse. To learn more about it, see my T2108 Resource Page. You can follow real-time T2108 commentary on twitter using the #T2108 hashtag. T2108-related trades and other trades are posted on twitter using the #120trade hashtag)
T2108 Status: 78.5% (Overbought day #9)
VIX Status: 13.4 (steady throughout overbought period)
General (Short-term) Trading Call: Short.
Active T2108 periods: Day #86 over 20% (overperiod), Day #9 over 70%
Reference Charts (click for view of last 6 months from Stockcharts.com):
S&P 500 or SPY
SDS (ProShares UltraShort S&P500)
U.S. Dollar Index (volatility index)
EEM (iShares MSCI Emerging Markets)
VIX (volatility index)
VXX (iPath S&P 500 VIX Short-Term Futures ETN)
EWG (iShares MSCI Germany Index Fund)
CAT (Caterpillar)
Commentary
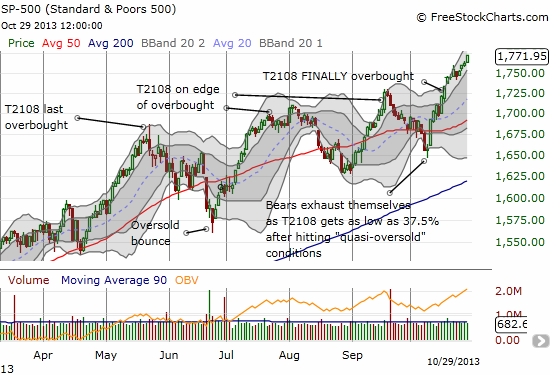
Looks like the last T2108 Update was appropriately titled: “Bearish But Looking Out for An Extended Overbought Rally.” The S&P 500 (SPY) has steadily and stubbornly marched higher throughout much of the overbought period. It has now gained 2.2% since going overbought, putting the S&P 500’s performance at the very top of the expected range if the overbought period ended today.
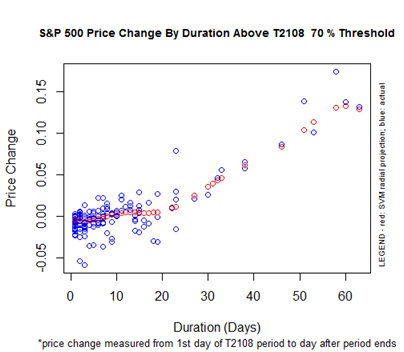
Note that the projected performance for the S&P 500 during the overbought period pushes upward right now. In about 11 days, T2108 will flip another threshold into bullish territory, what I like to call the extended overbought period. For now, with the S&P 500 at the top of the range and the volatility index (VIX) staying steady (albeit near multi-year lows) throughout the overbought period, it still makes sense to open a fresh short position if you do not yet have one. The big caveat of course is that the data suggest that this is the last stand for the bears for a while. The next bearish trigger will either be a trip to 80% or above for T2108 or a drop below the overbought threshold of 70%. For now, the current uptrend for the S&P 500 is very strong, marching in a near orderly fashion….
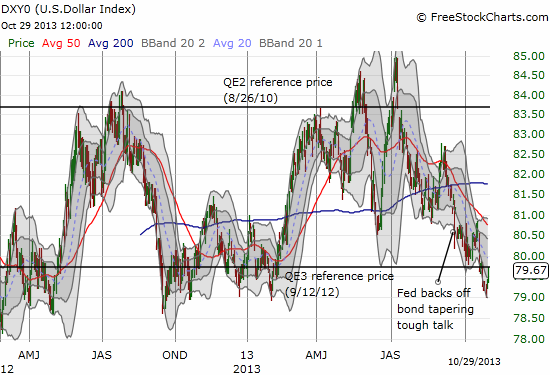
Next up is the U.S. Federal Reserve. I still find it surreal to combine an on-going easy money policy with a stock market that continues to press to all-time highs. Meanwhile, the ailment easy money is supposed to cure, the labor market and low inflation, largely refuses to respond any further. Even more surreal is that the U.S. dollar index is only back to where it was when QE3 was announced last year. During most of the intervening months, the U.S. dollar was higher. It is enough to make my head spin. I only stay anchored by watching the technicals: they make their own sense…
Daily T2108 vs the S&P 500
")
Black line: T2108 (measured on the right); Green line: S&P 500 (for comparative purposes)
Red line: T2108 Overbought (70%); Blue line: T2108 Oversold (20%)
Weekly T2108

*All charts created using freestockcharts.com unless otherwise stated
Related links:
The T2108 Resource Page
Expanded daily chart of T2108 versus the S&P 500
Expanded weekly chart of T2108
Be careful out there!
Full disclosure: long SSO puts, net long U.S. dollar