
(T2108 measures the percentage of stocks trading above their respective 40-day moving averages [DMAs]. It helps to identify extremes in market sentiment that are likely to reverse. To learn more about it, see my T2108 Resource Page. You can follow real-time T2108 commentary on twitter using the #T2108 hashtag. T2108-related trades and other trades are posted on twitter using the #120trade hashtag)
T2108 Status: 65.6%
VIX Status: 15.5 (down 6.4%)
General (Short-term) Trading Call: Hold
Active T2108 periods: Day #66 over 20% (overperiod), Day #1 over 60%, Day #91 under 70%
Reference Charts (click for view of last 6 months from Stockcharts.com):
S&P 500 or SPY
SDS (ProShares UltraShort S&P500)
U.S. Dollar Index (volatility index)
EEM (iShares MSCI Emerging Markets)
VIX (volatility index)
VXX (iPath S&P 500 VIX Short-Term Futures ETN)
EWG (iShares MSCI Germany Index Fund)
CAT (Caterpillar)
Commentary
I guess we should have government shutdowns more often.
It turns out that I was not so crazy after all in describing this market as one that wants to go up. In the last T2108 Update I pointed to the relatively mild decline in the S&P 500 (SPY) given the big pop in the VIX combined with the mild behavior in T2108 as signs that the market was biased for upside. All it took was for the government to shut down – uh, I mean for the beginning of the month trade – to trigger the pop to the upside.
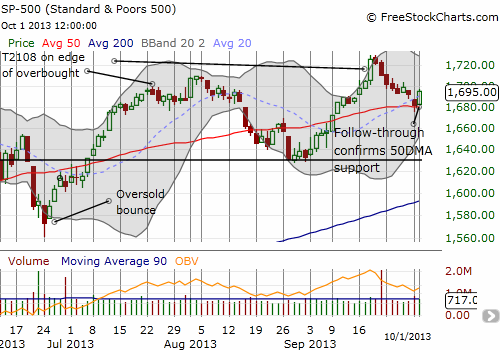
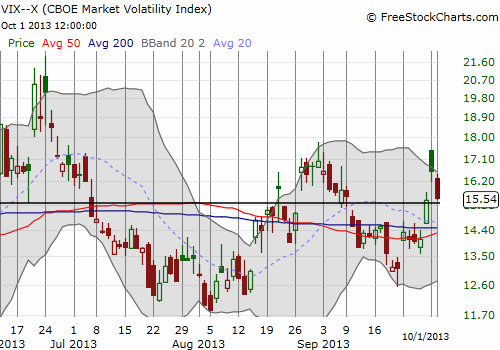
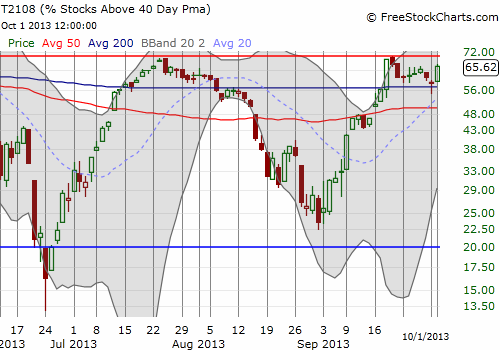
Note that T2108 surged upward along with the market. At 65.6%, it is closing in on overbought again. Looks like only a complete collapse of the Federal government stands in its way now… (or at least I assume the market will care if the government stops paying its bills).
In case you were wondering, this is what the history of trading looks like for October since 1950. The x-axis is the S&P 500’s one-day change on the first day of the trading month. The y-axis represents the index’s performance for the rest of October. At some point, I am going to publish my overall analysis of first-of-the-month trading.
Click image for a larger view…
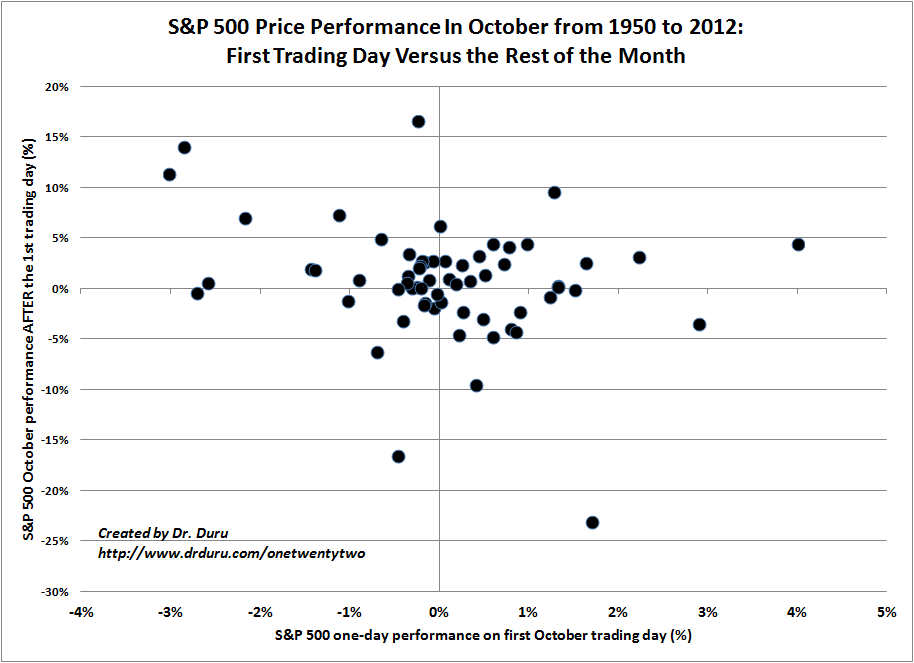
First Trading Day Versus the Rest of the Month
October’s spread in performance is the largest of any month in the year. Hopefully you can see that a strong start to the month is far from a guarantee of good tidings for the rest of the month. In fact, the odds for a good rest of the month are higher if the first trading day delivers a negative performance. Some of the best rest-of-month performances have happened after October got off to a VERY rocky start.
With this view, I am much more inclined to short early and aggressively if T2108 flips to overbought. EEM (iShares MSCI Emerging Markets) provides an interesting caveat because its stochastics are now oversold, and the S&P 500‘s stochastics are essentially oversold! Depending on how stochastics unfold along with T2108, I may have to wait a few extra days for the stochastics to “catch up” with T2108. Stay tuned!
Daily T2108 vs the S&P 500
")
Black line: T2108 (measured on the right); Green line: S&P 500 (for comparative purposes)
Red line: T2108 Overbought (70%); Blue line: T2108 Oversold (20%)
Weekly T2108

*All charts created using freestockcharts.com unless otherwise stated
Related links:
The T2108 Resource Page
Expanded daily chart of T2108 versus the S&P 500
Expanded weekly chart of T2108
Be careful out there!
Full disclosure: long EEM strangle (out-of-money calls and puts), long VXX
The last couple years, the “innovation” meme has gotten a lot of attention. Well, that first-day-of-month vs. rest-of-month graph is unique in my experience – and I’ve been investing, and reading about investing, since the 1970’s.
I note that the scale of the axes clearly illustrates how one-day moves dwarf the scale of changes over longer periods. Lesson: grit your teeth and fade all extrema!
Keep bringing’ it, Doc!
That’s a great way of looking at it. And, as you know, T2108 is allow about fading the extrema. Full-year analysis to come sometime this month. Meanwhile, for all readers out there, just remember that as frightening as October is on a historical basis, it has almost always paid to buy October’s weakness “in the fullness of time.”