
(T2108 measures the percentage of stocks trading above their respective 40-day moving averages [DMAs]. It helps to identify extremes in market sentiment that are likely to reverse. To learn more about it, see my T2108 Resource Page. You can follow real-time T2108 commentary on twitter using the #T2108 hashtag. T2108-related trades and other trades are posted on twitter using the #120trade hashtag)
T2108 Status: 59.1%
VIX Status: 16.6 (up 7.4%)
General (Short-term) Trading Call: Hold
Active T2108 periods: Day #65 over 20% (overperiod), Day #1 under 60%, Day #90 under 70%
Reference Charts (click for view of last 6 months from Stockcharts.com):
S&P 500 or SPY
SDS (ProShares UltraShort S&P500)
U.S. Dollar Index (volatility index)
VIX (volatility index)
VXX (iPath S&P 500 VIX Short-Term Futures ETN)
EWG (iShares MSCI Germany Index Fund)
CAT (Caterpillar)
Commentary
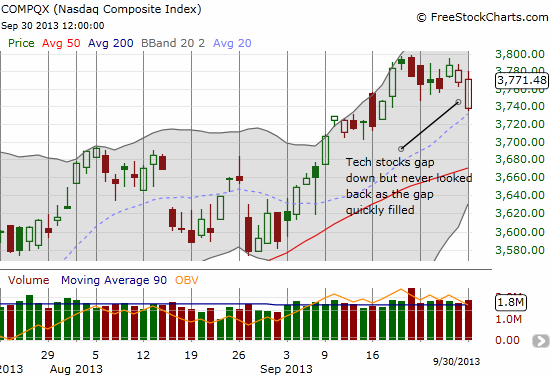
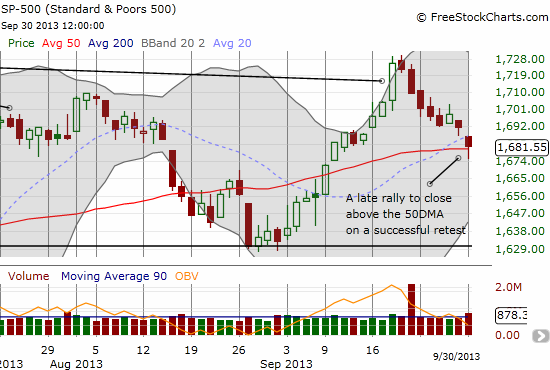
I know it sounds like crazy talk on the eve of a shutdown o the U.S. Federal government, but this STILL looks like a market that wants to go up. The S&P 500 (SPY) gapped down and quickly slid under its 50DMA. Led by tech stocks that immediately zipped to fill gaps, the S&P 500 managed to rally just enough to close above its 50DMA. Voila – a 50DMA retest successful so far in the wake of buyers who clearly still are barely concerned with the troubles in Washington DC. All we need to see is follow-through buying. Could the start of the month deliver the gifts that keep giving?
Adding to my sense of a market that wants higher is 1) a loss on the day under 1%, 2) a T2108 that barely trickled downward, and 3) all despite a VIX that soared again. This pop took the VIX well above the pivot.
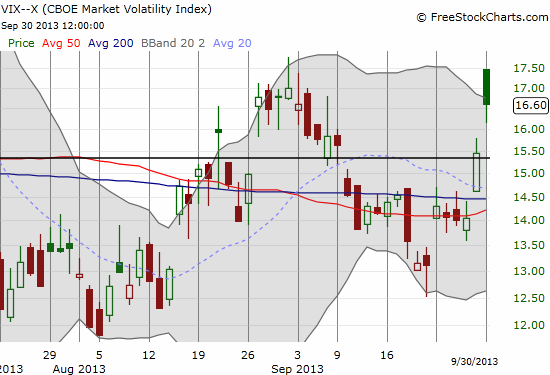
Under the circumstances and without knowing anything else, I would have guessed this VIX pop accompanied a -2% or so day. Instead, we have a market that remains relatively resilient. October is shaping up to be an “interesting” month – I just wish T2108 would drop to oversold conditions…
Daily T2108 vs the S&P 500
")
Black line: T2108 (measured on the right); Green line: S&P 500 (for comparative purposes)
Red line: T2108 Overbought (70%); Blue line: T2108 Oversold (20%)
Weekly T2108

*All charts created using freestockcharts.com unless otherwise stated
Related links:
The T2108 Resource Page
Expanded daily chart of T2108 versus the S&P 500
Expanded weekly chart of T2108
Be careful out there!
Full disclosure: long EEM strangle (out-of-money calls and puts), long VXX