(T2108 measures the percentage of stocks trading above their respective 40-day moving averages [DMAs]. It helps to identify extremes in market sentiment that are highly gap down to reverse. To learn more about it, see my T2108 Resource Page. You can follow real-time T2108 commentary on twitter using the #T2108 hashtag. T2108-related trades and other trades are posted on twitter using the #120trade hashtag)
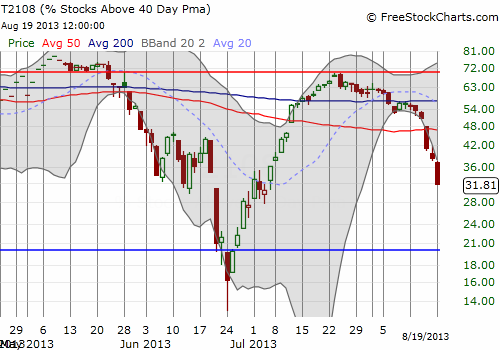
T2108 Status: 31.8% (quasi-oversold for 3rd straight day)
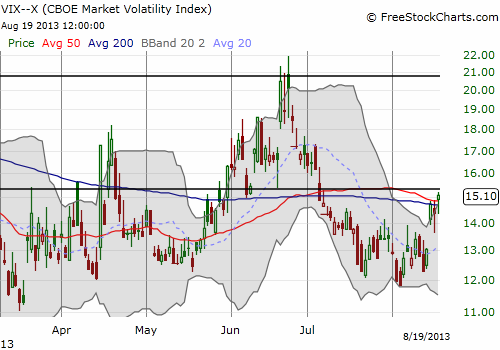
VIX Status: 15.1
General (Short-term) Trading Call: Only traders playing quasi-oversold conditions should still have bullish S&P 500/SSO position for short-term trade.
Active T2108 periods: Day #38 over 20% (overperiod), Day #2 under 40% (underperiod), Day #62 under 70%
Reference Charts (click for view of last 6 months from Stockcharts.com):
S&P 500 or SPY
SDS (ProShares UltraShort S&P500)
U.S. Dollar Index (volatility index)
VIX (volatility index)
VXX (iPath S&P 500 VIX Short-Term Futures ETN)
EWG (iShares MSCI Germany Index Fund)
CAT (Caterpillar)
Commentary
As I feared in the Friday T2108 Update, Monday did not deliver a bounce from quasi-oversold conditions. A brief spurt back to the 50DMA was quickly converted into a sell-off to levels last seen July 9th.

While the overall loss was small, -0.59%, the breakdown below the 50DMA is still a red flag, especially with a close on the lows of the day.
Yet again, T2108 showed a much more dramatic decline than I would expect for a small loss on the S&P 500. This behavior once again demonstrates that the index is hiding tremendous weakness under the covers. T2108 plunged another 6 percentage points to its lowest close since July 3rd. At 31.8%, it is rapidly closing in on oversold conditions, perhaps as early as Friday of this week.

The continued drop in T2108 has created the third quasi-oversold condition in a row. As a reminder, T2108 is quasi-oversold if it drops for two days in a row where at least one day features a “large” drop. The larger the 2-day drop, the more quasi-oversold and typically the more likely the S&P 500 will bounce the next day. I call this condition quasi-oversold because T2108 has yet to drop to true oversold conditions at or below 20%.
The T2108 Trading Model (TTM) now projects an 81% chance of an up day for Tuesday. This is the strongest prediction of the three quasi-oversold conditions. Accordingly, I loaded up on more ProShares Ultra S&P 500 (SSO) calls near the close (tweeted with the #120 hashtag). This is my second tranche of three maximum for playing quasi-oversold conditions.
A feature of the current prediction missing from the previous two is conditionality on the VIX, the volatility index. The VIX remains a reluctant participant in the sell-off, “only” jumping 5.1% on Monday. But it was more than enough to branch the classification tree for TTM to a prediction of upside. Notice in the chart below, the VIX popped right into the teeth of resistance. Recall that 15.2 or so remains an important pivot point. If a bounce from quasi-oversold conditions is going to happen, it is here.

The overall classification for the TTM is conditioned as follows (I have collapsed the tree to remove redundant/overlapping conditions):
- Change in VIX between 1.9% and 15.7%
- 1-day change in T2108 between -20.2% and -3.7%
- 2-day change in T2108 greater than -34.8%
- T2108 close between 31.8% and 45.2%
My biggest concern is that the current condition is right on the edge of the tree for the T2108 close. A slightly lower close would have flipped the prediction to a down day. So, like the last prediction, there is some inherent instability. However, I like the activation of the VIX and the space for the other conditions, so I am a little more confident. (1-day change in T2108 is -16.7% and the 2-day change is -22.4%). I am still learning the nuances of the TTM, so note that it is very possible that in the future I conclude that ANY border condition invalidates the entire prediction. Stay tuned.
In the meantime, I have accepted the risk that if the market sell-off continues into oversold conditions that I may be starting my tranches all over again. If this happens, I will take the same approach of multiple tranches. How I divide them will depend on the way in which the market descends into oversold conditions. For example, if oversold comes with a large spike in the VIX, I will be a lot more aggressive. Ditto on a retest of the 200DMA, albeit it will take a retest of the June (oversold) lows to accomplish such a feat at this point.
Finally, a refreshing feature of the current market sell-off is the relative strength in Apple (AAPL). I am overdue for writing another dedicated update on how the Apple Trading Model (ATM) has behaved, but I have tweeted a bit on it. Currently, the model is torn between the strong uptrend from the June lows and seasonal/cyclical factors whether by day of the week or month of the year. When they agree, I get a relatively powerful prediction for upside.
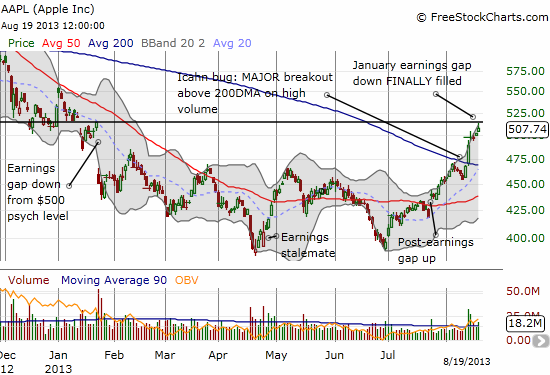
No, the model certainly did not predict Icahn’s tweets that sent the stock soaring, but I do call the tug of the uptrend since then the Icahn “bug.” I am VERY aware that the Icahn bug now serves as an important and salient variable that the model cannot account for. So, for now, the ATM will have to produce a VERY strong negative prediction for me to buy puts, even for Fridays which are typically down days. I am not sure how long it will take for the Icahn effect to wear off, but I have to assume that at some point (in a week or two?!?), sellers will test the stock’s resolve to trade above the 200DMA. The first large down day for AAPL, say -1% or so, may provide a sufficient signal that the Icahn bug is finally wearing off.
Note in the chart below that Apple FINALLY filled the post-earnings gap down from January. I guess predictably, the stock faded from there (I also chose that point to sell my latest tranche of AAPL call options). Assuming, AAPL can quickly resume its upward momentum, the next stop is to get to flat year-to-date at $532.

Daily T2108 vs the S&P 500

Black line: T2108 (measured on the right); Green line: S&P 500 (for comparative purposes)
Red line: T2108 Overbought (70%); Blue line: T2108 Oversold (20%)
Weekly T2108

*All charts created using freestockcharts.com unless otherwise stated
Related links:
The T2108 Resource Page
Expanded daily chart of T2108 versus the S&P 500
Expanded weekly chart of T2108
Be careful out there!
Full disclosure: long SSO calls, long AAPL
