
(T2108 measures the percentage of stocks trading above their respective 40-day moving averages [DMAs]. It helps to identify extremes in market sentiment that are highly gap down to reverse. To learn more about it, see my T2108 Resource Page. You can follow real-time T2108 commentary on twitter using the #T2108 hashtag. T2108-related trades and other trades are posted on twitter using the #120trade hashtag)
T2108 Status: 38.1%
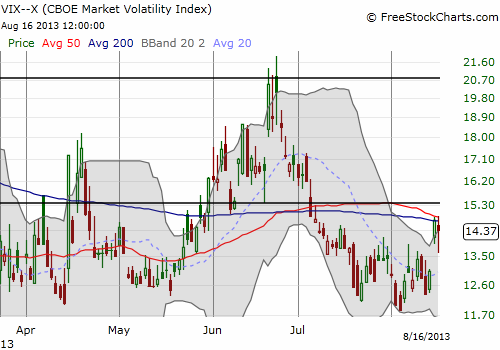
VIX Status: 14.4
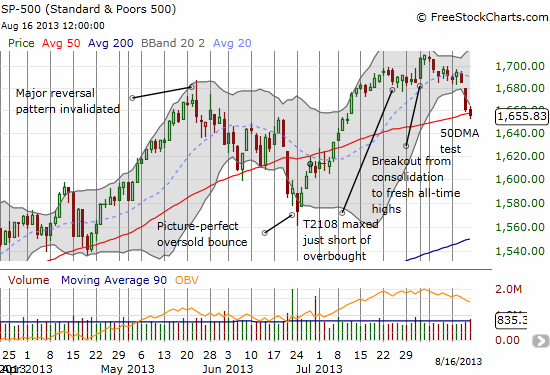
General (Short-term) Trading Call: Aggressive traders can still play for a bounce from 50DMA
Active T2108 periods: Day #37 over 20% (overperiod), Day #1 under 40% (underperiod), Day #61 under 70%
Reference Charts (click for view of last 6 months from Stockcharts.com):
S&P 500 or SPY
SDS (ProShares UltraShort S&P500)
U.S. Dollar Index (volatility index)
VIX (volatility index)
VXX (iPath S&P 500 VIX Short-Term Futures ETN)
EWG (iShares MSCI Germany Index Fund)
CAT (Caterpillar)
Commentary
An oversold bounce was very weak Friday morning and eventually gave way to a weak close. Once again, T2108 dropped a lot more than I would expect for the move in the S&P 500 (SPY). The index closed a fraction down, barely enough to slip it below its 50DMA, while T2108 lost three percentage points.
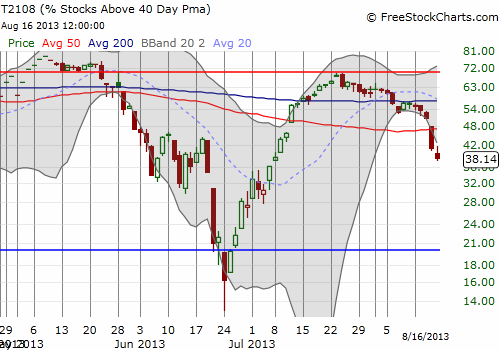
Quasi-oversold conditions continue with T2108 sagging further. In fact, it is even more oversold than it was the day before. Interestingly, the T2108 Trading Model (TTM) is projecting an up day on Monday but at a lower likelihood than for Friday, 61% versus 78%. Moreover, the branch in the classification tree that divides the current scenario between a down and an up day is a T2108 close less than 38.43. T2108 closed on Friday at 38.14. If it had closed a fraction higher, the TTM would give a 100% chance of a down day (a total of 9 historical occurrences). This examination is a great reminder that it is important to understand the structure of the model at hand and not to just let it run on automatic. This setup also reminds why I like classification trees so much: it is easy to see the model’s structure and understand the decision points. These data indicate that the current prediction is much more tenuous than the final result indicates.
So now I am on alert for even more downside, perhaps to true oversold conditions within a few days. In the meantime, I bought a few SSO calls on Friday to play quasi-oversold conditions; it was a small amount because of the tentative nature of the retest of the 50DMA. I will be much more aggressive from here if/when T2108 dips below 30%.
The interesting twist to Friday’s action was the VIX. It dipped significantly before closing the day flat. The chart below shows how the 50 and 200DMA have capped the VIX for two straight days. A push through this resistance could create a swift move higher. This possibility adds to my desire to prepare for a swift move closer to oversold conditions in the next few days.
Daily T2108 vs the S&P 500
")
Black line: T2108 (measured on the right); Green line: S&P 500 (for comparative purposes)
Red line: T2108 Overbought (70%); Blue line: T2108 Oversold (20%)
Weekly T2108

*All charts created using freestockcharts.com unless otherwise stated
Related links:
The T2108 Resource Page
Expanded daily chart of T2108 versus the S&P 500
Expanded weekly chart of T2108
Be careful out there!
Full disclosure: long SSO callsw