
(T2108 measures the percentage of stocks trading above their respective 40-day moving averages [DMAs]. It helps to identify extremes in market sentiment that are highly likely to reverse. To learn more about it, see my T2108 Resource Page. You can follow real-time T2108 commentary on twitter using the #T2108 hashtag. T2108-related trades and other trades are posted on twitter using the #120trade hashtag)
T2108 Status: 73.3% (11th straight overbought day)
VIX Status: 12.5
General (Short-term) Trading Call: Hold
Reference Charts (click for view of last 6 months from Stockcharts.com):
S&P 500 or SPY
SDS (ProShares UltraShort S&P500)
U.S. Dollar Index (volatility index)
VIX (volatility index)
VXX (iPath S&P 500 VIX Short-Term Futures ETN)
EWG (iShares MSCI Germany Index Fund)
CAT (Caterpillar)
Commentary
One of the best features of this sustained overbought period is that I am not fighting it. The recent overhaul of the T2108 Trading Model (TTM) allows me to respect the potential for the continued momentum that can come from overbought periods, especially in recent years. THe current bullrush is as strong as any of the others we have seen; it comes withthe added bonus of setting fresh all-time highs with each new high. Friday was not only the 11th straight overbought day (the 70% overperiod), but it is also the 21st straight day above the 40% threshold (the 40% overperiod 0 the first threshold crossed when the current rally began).
Based on TTM, the projected performance for the S&P 500 (SPY) after the overperiods end is starting to improve. The projected performance for the 40% overperiod is moving up from its low point around 20 days.
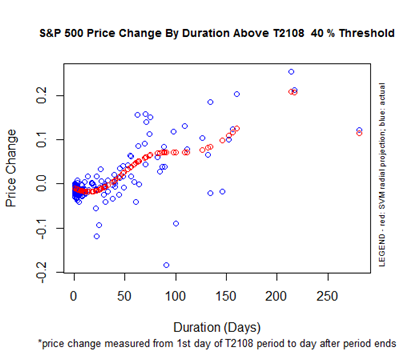
Note well that the 40% overperiod must last for at least 50 days before the projected performance reaches 0%. The S&P 500 has returned 7.2% since the 40% overperiod began on April 19th with the index bouncing off its 50DMA. In other words, shorting the index here should return at least 7.2% at some point. However, the mean duration for the 40% overperiod is close to 50 days (the median is only about 10 days). A trader could be waiting quite a long time to realize this return and in the meantime experience significant upside risk. To mitigate this risk, I have established a requirement that the index must break some important support level before shorting, whereas before I was OK taking an aggressive, proactive stance with overbought periods.
I have revised the bear/bull dividing line to 1623.19. This line is directly below the last period of consolidation during this rally. A close below that line will trigger SSO puts with a (first) downside target to the 50DMA.
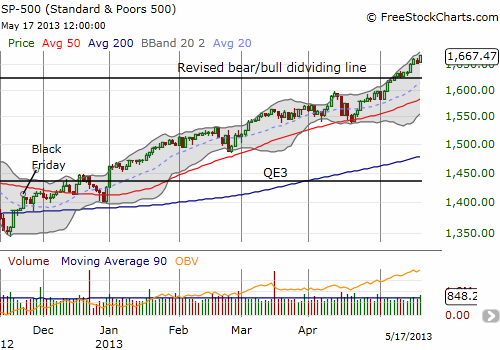
You aggressive bulls that bought the breakout above 1600 are doing just fine…and yes, I am getting jealous!
So what about the overbought period, the 70% overperiod? The S&P 500 has gained 3.3% since the overbought period began on May 3rd. This performance is already beyond the expected performance for any 70% overperiod lasting less than 25 days or so. So, again, theoretically, shorting here should eventually return positive gains. The index is also right around where I expect it to be for a maximum return after 11 days. In other words, making fresh bullish bets at this point carry a high risk, but there is still no trigger yet for making a good risk/reward short bet. So, I continue to wait. As a reminder, I only focus on bullish bets on the S&P 500 after the overbought period lasts over 25 days.
In the meantime, I have no problem betting on individual stocks with proper setups. These are good bets as long as they have the tailwind of a very bullish market.
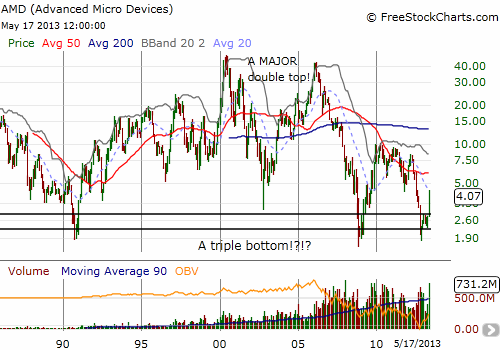
Case in point for this point is Advanced Micro Devices (AMD). I missed a nice breakout on May 1st. AMD delivered the double whammy of a breakout from an extended consolidation period. This consolidation occurred after a sharp bounce from lows which retested AMD’s 2009 lows. Buying volume has been very robust every since the breakout. This is a very strong chart where dips can and should be bought. Note how quickly buyers jumped on the dip from Thursday’s gap down, leaving a long tail on Thursday’s candlestick and solid follow-through for the comeback on Friday. I am putting AMD on the active radar. I may never buy into it, but it is hard to imagine the stock market getting bearish until speculative bottom-fishing in stocks like AMD comes to an end.

Daily T2108 vs the S&P 500
")
Black line: T2108 (measured on the right); Green line: S&P 500 (for comparative purposes)
Red line: T2108 Overbought (70%); Blue line: T2108 Oversold (20%)
Weekly T2108

*All charts created using freestockcharts.com unless otherwise stated
Related links:
The T2108 Resource Page
Expanded daily chart of T2108 versus the S&P 500
Expanded weekly chart of T2108
Be careful out there!
Full disclosure: net short euro; long CAT shares and puts; long AAPL shares, calls, and puts; long TSLA calls (PURE speculation!), ANGI calls,