(T2108 measures the percentage of stocks trading above their respective 40-day moving averages [DMAs]. It helps to identify extremes in market sentiment that are highly likely to reverse. To learn more about it, see my T2108 Resource Page. You can follow real-time T2108 commentary on twitter using the #T2108 hashtag. T2108-related trades and other trades are posted on twitter using the #120trade hashtag)
T2108 Status: 59.3%
VIX Status: 13.4
General (Short-term) Trading Call: Hold
Reference Charts (click for view of last 6 months from Stockcharts.com):
S&P 500 or SPY
SDS (ProShares UltraShort S&P500)
U.S. Dollar Index (volatility index)
VIX (volatility index)
VXX (iPath S&P 500 VIX Short-Term Futures ETN)
EWG (iShares MSCI Germany Index Fund)
CAT (Caterpillar)
Commentary
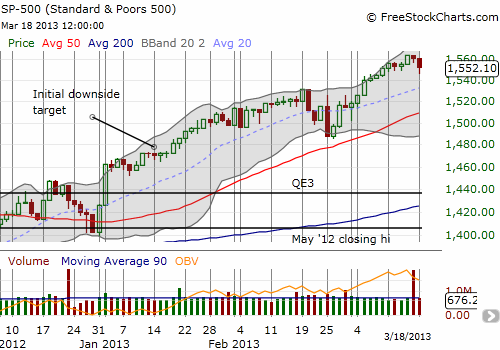
Almost two weeks ago, I wrote that the S&P 500 had been uncorked in my last T2108 Update. Since that fresh multi-year high, the S&P 500 is up a mere 0.8%, and T2108 has actually declined by 1.5 percentage points. I have held off writing a T2108 Update until *something* different happened; Monday March 18th’s action is as close as we have come in a while to something different as the market reacted to news out of Cyprus.
In typical fashion, buyers stepped into the Monday morning gap but this time they took profits early and forced a weak close on the S&P 500.

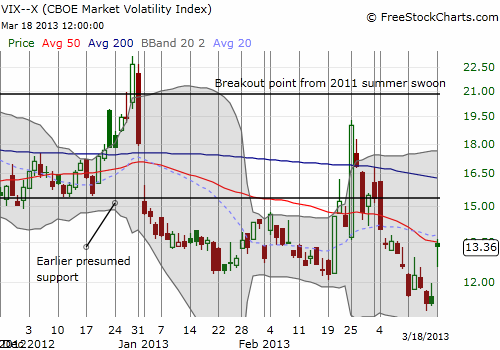
Even volatility managed to stage a comeback as the VIX closed at its high of the day.

I think that the weak close and VIX strength on the day suggests more downside in the market is coming. We will have to wait a while longer to celebrate all-time highs on the S&P 500. While we wait, I thought I would take a look at the history of all-time highs on the S&P 500…
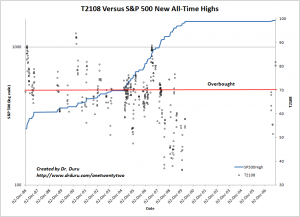
T2108 has been drifting in a tight range while the S&P 500 has made progress measured in centimeters. In “Poor Consumer Sentiment Underlines Poor Participation In Market Highs“, I argued that this divergence is bearish, especially since the S&P 500 is scraping at all-time highs. I decided to take a look at T2108’s behavior when the S&P 500 closes at a fresh all-time high. Interestingly, of the 384 days since 1986 that the S&P 500 has closed at a fresh all-time high, T2108 was overbought (at least 70%) only 163 of these days – only 42% of the time. Amazingly, there have been times when T2108 was as low as 40%! The following chart shows this history.
Click for a larger view

The red line in the chart shows where T2108 was overbought. T2108 is measured by the scale on the right-hand side. It appears on the chart in dots. The S&P 500 is drawn in log scale. It appears as a blue line: for every given day, this line shows the last price at which the S&P 500 was at an all-time high. Note the drought from 2000 to 2007; this is where the blue line goes flat for an extended period of time. The chart ends there of course as we wait for the current bull run to produce its own fresh all-time high.
As you can imagine, seeing this chart surprised me. Instead of a clustering above 70%, there is more of a clustering from 60 to 70% or so. Moreover, over time, T2108’s low range has steadily dropped for days where the S&P 500 has hit a new all-time high. I am still processing all the implications of these data and welcome any thoughts. I will be including a more comprehensive assessment in a coming review of T2108 that will use some data mining techniques to generate additional insights.
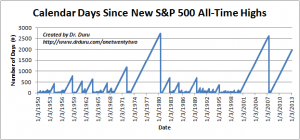
Until then, here is another way to look at the S&P 500’s all-time highs. The chart below shows the days since the last all-time high for every given day since 1950. This is a nice reminder that at SOME point, we will revisit an era where making new all-time highs will be a commonplace headline. We just did not appreciate how good we had it back in the day!
Click for a larger view

Daily T2108 vs the S&P 500

Black line: T2108 (measured on the right); Green line: S&P 500 (for comparative purposes)
Red line: T2108 Overbought (70%); Blue line: T2108 Oversold (20%)
Weekly T2108

*All charts created using freestockcharts.com unless otherwise stated
Related links:
The T2108 Resource Page
Expanded daily chart of T2108 versus the S&P 500
Expanded weekly chart of T2108
Be careful out there!
Full disclosure: long VXX shares and puts
