(T2108 measures the percentage of stocks trading above their respective 40-day moving averages [DMAs]. It helps to identify extremes in market sentiment that are highly likely to reverse. To learn more about it, see my T2108 Resource Page. You can follow real-time T2108 commentary on twitter using the #T2108 hashtag. T2108-related trades and other trades are posted on twitter using the #120trade hashtag)
T2108 Status: 55.7%
VIX Status: 15.36 (magically closed directly on support!)
General (Short-term) Trading Call: Hold
Reference Charts (click for view of last 6 months from Stockcharts.com):
S&P 500 or SPY
SDS (ProShares UltraShort S&P500)
U.S. Dollar Index (volatility index)
VIX (volatility index)
VXX (iPath S&P 500 VIX Short-Term Futures ETN)
EWG (iShares MSCI Germany Index Fund)
CAT (Caterpillar)
Commentary
For a brief 15 minutes after the open, I felt like a genius having bought SSO puts near Thursday’s high. As the S&P 500 approached the psychologically important round number of 1500, the intraday decline ground to a halt, and a 1% loss turned into a 0.2% gain by the close.

I will not cover the headlines that likely had a lot to do with the push and pull in the market. I will only note the first day of the month likely worked its magic yet again. For calendar reasons alone, I should have been prepared to take what profits I had and take them quickly!
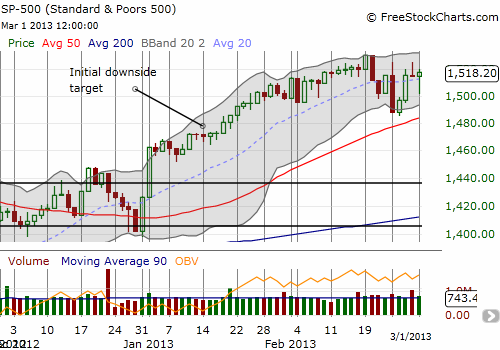
I posted a close-up of the S&P 500 so you could actually focus in on the chop over the last three weeks. Through all the excitement, chills, and spills, it is easy to forget that the index has essentially gone nowhere in almost three weeks. Over that time, T2108 has fallen from overbought (from 74.8% to 55.7%). This decline is a “yellow flag” to me: it demonstrates that although the major index looks like it is hanging tough, many stocks are getting left behind. Eventually, enough will falter to bring the index down with them. Assuming Friday’s jobs number contains the same ol’, same ol’, I have to believe that my downside target for the S&P 500 will get hit in these next two weeks.
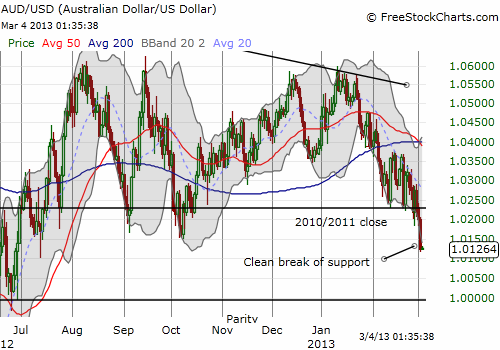
Bearish signals still abound, and I see almost no countervailing bullish signals. Tonight, the Australian dollar (FXA) became a bright red flag as it lunged toward parity ahead of Monday’s rate decision from the Reserve Bank of Australia (RBA). As a reminder, I have noted how the Australian dollar has reliably provided leading signals for the S&P 500.

When the Australian dollar breaks down, it tends to do so at a rapid clip. Given how stubbornly the market has chased yield with the Australian dollar, any further plunges could be particularly abrupt and sharp as the herd struggles to get out the way all at once. This tension will also work in the other direction; that is, positive news could send the Aussie hurtling higher at a rapid clip as participants rush back in “relief.” Regardless, the RBA continues to make it clear that it thinks the Australian dollar is very overvalued, and I believe it.
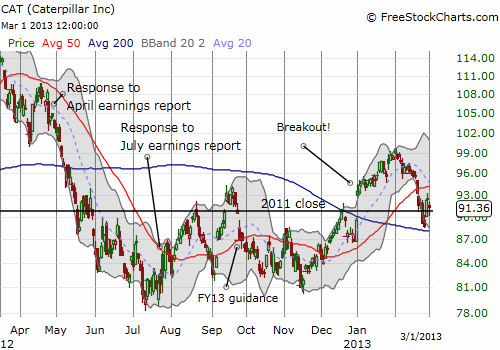
Finally, I have taken my eye of Caterpillar (CAT) for too long. It is still my favorite tell on the market. While CAT remains well off its 2011 and 2012 all-time highs, largely thanks to slowness in commodity markets, CAT did sprint with the S&P 500 at the beginning of this year. The stock made a clean break above the 200DMA, trading above that level for the first time since the May swoon began last year. It looked like a breakout that confirmed the bullishness on the S&P 500. Yet, the rally peaked at the end of January. By mid-February, CAT was back to flat on the year. The stock even punctured through presumed support at the 2011 close. While the 200DMA held, I am thinking this behavior directly contradicts the current bullishness on the S&P 500.

Given the Black Friday trade remains alive and well, I am still not predicting any major market breakdown, just a “simple” pullback. The coming dip will very likely be quite buyable.
T2108 data mining update: I had my first breakthrough in using data mining techniques to device trading rules for T2108 based on historical data (very exciting!). It turned up a VERY surprising result: the VIX has absolutely no role in applying trading rules for cases where T2108 declines two days in a row. Note that these are preliminary results – I still need to do validations and assess error rates – but I think the insignificance of the VIX will stand. Also note that while manually I was not able to find any reliable correlations between a 2-day decline and any behavior on the S&P 500, the classification algorithm that I ran was definitely able to pick up some subtle relationships. Stay tuned!
Daily T2108 vs the S&P 500

Black line: T2108 (measured on the right); Green line: S&P 500 (for comparative purposes)
Red line: T2108 Overbought (70%); Blue line: T2108 Oversold (20%)
Weekly T2108

*All charts created using freestockcharts.com unless otherwise stated
Related links:
The T2108 Resource Page
Expanded daily chart of T2108 versus the S&P 500
Expanded weekly chart of T2108
Be careful out there!
Full disclosure: long VXX shares and puts, long SSO puts, long CAT
