(T2108 measures the percentage of stocks trading above their respective 40-day moving averages [DMAs]. It helps to identify extremes in market sentiment that are highly likely to reverse. To learn more about it, see my T2108 Resource Page. You can follow real-time T2108 commentary on twitter using the #T2108 hashtag. T2108-related trades and other trades are posted on twitter using the #120trade hashtag)
T2108 Status: 81.5% (third overbought day)
VIX Status: 13.8
General (Short-term) Trading Call: Initiate SMALL short positions, sell some longs
Reference Charts (click for view of last 6 months from Stockcharts.com):
S&P 500 or SPY
SDS (ProShares UltraShort S&P500)
U.S. Dollar Index (volatility index)
VIX (volatility index)
VXX (iPath S&P 500 VIX Short-Term Futures ETN)
EWG (iShares MSCI Germany Index Fund)
CAT (Caterpillar)
Commentary
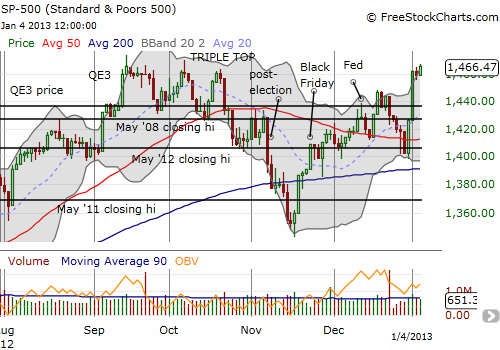
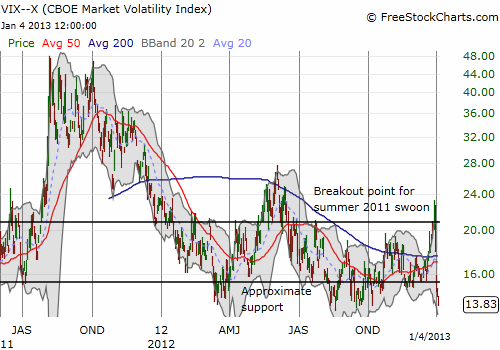
On September 14, 2012, the S&P 500 set a closing 52-week and 5-year high at 1465.77; that same day the intra-day high printed at 1474.51. On Friday, the index closed at 1466.47. The 0.5% gain was marginal, but it was enough to push T2108 to a further extreme – you guessed it, last seen on September 14th. Adding to the extremes, the VIX (the volatility index) is also at extremes, right at 52-week lows. The VIX actually bounced from lows to notch a gain on September 14th.


The new 52-week high for the S&P 500 was so marginal it did not trigger a stop-out for the SSO puts I decided to buy on Thursday. In fact, I ADDED to those puts on Friday. I have now decided to let these puts stop themselves in a boom or bust scenario. The combination of T2108 at extreme overbought conditions along with the VIX at extreme lows is just too much to resist: the odds of a sharp and sudden sell-off by the time these puts expire in two weeks are high enough to warrant just sitting on them. I will reload if T2108 somehow manages to get the rarest of rare 90% reading. I would NOT do this if I owned SDS shares (or a short on SPY, etc..) given the losses from a steady overbought rally could mount quickly.
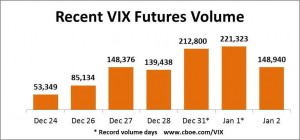
How could the market keep rallying with complacency so seemingly high? Well, it is very possible the surge in volatility measures going into the Fiscal Cliff resolution washed out enough fear to last for a good, long while. On Friday, the CBOE tweeted a chart showing record volume on VIX futures going into January 1st. Click the chart for a more detailed view…

Source: CBOE tweet
Motivating my positioning with the puts is my parallel position in VXX shares and puts. As anticipated, I am in a position now where the more VXX loses, the more I gain on this paired position. I am assuming a “melt-up” on the S&P 500 will absolutely crush VXX. In other words, I am in a hedged position that can win big if the market makes a continued move up or a big move down. I hope to refine this method of combining SSO puts with VXX shares and puts in the coming weeks and months. Given the Fiscal Cliff agreement resolved so little on fiscal policy, I am anticipating a lot of violent swings and volatility in the coming months as politicians continue to wrestle with the country’s difficult economic issues. Next up, earnings season!
Daily T2108 vs the S&P 500

Black line: T2108 (measured on the right); Green line: S&P 500 (for comparative purposes)
Weekly T2108

*All charts created using freestockcharts.com unless otherwise stated
Related links:
The T2108 Resource Page
Expanded daily chart of T2108 versus the S&P 500
Expanded weekly chart of T2108
Be careful out there!
Full disclosure: long VXX shares and puts; long CAT; short AUD/USD

record volume on VIX futures? What does this mean?
VIX futures are contracts betting on the future value of the volatility index, the VIX. See the CBOE website for more details.