(T2108 measures the percentage of stocks trading above their respective 40-day moving averages [DMAs]. It helps to identify extremes in market sentiment that are highly likely to reverse. To learn more about it, see my T2108 Resource Page. You can follow real-time T2108 commentary on twitter using the #T2108 hashtag. T2108-related trades and other trades are posted on twitter using the #120trade hashtag)
T2108 Status: 62.7%
VIX Status: 16.0
General (Short-term) Trading Call: Hold (assuming most positions from oversold bounce are closed out)
Reference Charts (click for view of last 6 months from Stockcharts.com):
S&P 500 or SPY
SDS (ProShares UltraShort S&P500)
U.S. Dollar Index (volatility index)
VIX (volatility index)
VXX (iPath S&P 500 VIX Short-Term Futures ETN)
EWG (iShares MSCI Germany Index Fund)
CAT (Caterpillar)
Commentary
On a day where the Federal Reserve upped the ante on its latest round of quantitative easing, it is poetically fitting that the S&P 500 perfectly pulled back from resistance at its QE3 price (the closing price of the S&P 500 the day before QE3 was announced). In yet another installment of “you can’t make this stuff up,” the S&P 500 actually faded in picture-perfect style for the second day in a row. The previous day, Tuesday, the S&P 500 also traded up to the QE3 price before fading back to…you guessed, its closing price on Election Day.
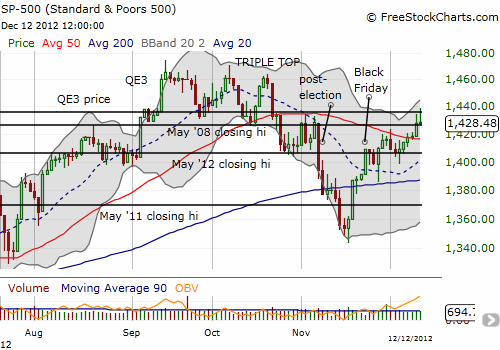
T2108 fell slightly to 62.7%. Given it closed at 64.3% the previous day, I strongly suspect that T2108 traded at overbought levels at the intraday high for the S&P 500. This is not enough to trigger an official T2108 overbought trade, but it is sufficient to get cautious in the context of the S&P 500 failing to overcome important resistance. Until T2108 hits official overbought levels, aggressive shorts do not make sense unless the S&P 500 closes below its 50DMA. Even so, make no mistake, the index still has a bullish bias. For example, the bullish post-Black Friday trade is still in effect. After the “fade the Fed” selling exhausts itself, buyers may rush right back into the market trying to ride the coattails of money-printing liquidity. Net-net, we have a great recipe for a lot of churning for the last trading weeks of the year.
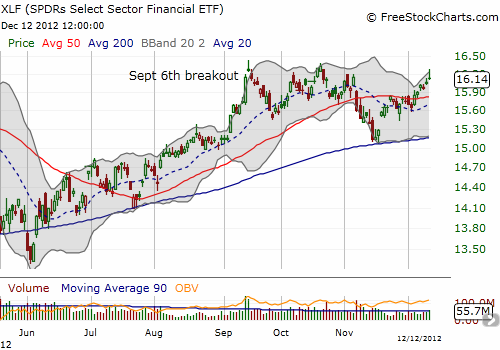
The SPDRs Select Sector Financial ETF (XLF) is a great reminder of the stock market’s bullish bias. XLF’s bounce from the June lows continues as the 200DMA held up as support during last month’s post-election selling. At Wednesday’s high, XLF was challenging its 52-week closing high.
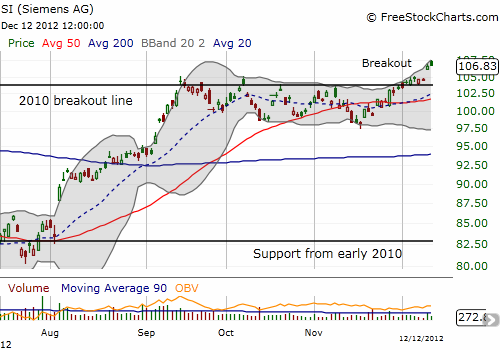
In the past few posts, I have pointed out the breakout potential in Siemens Atkins (SI) and Jinko Solar (JKS). Both have delivered since then, especially JKS which gained 19.5% on the day. I think the charts speak volumes.
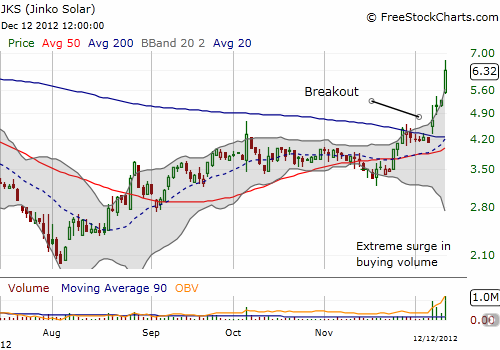
(See Bloomberg article on China’s increased solar subsidies if you want some fundamental rationale behind the big move in JKS and other Chinese solar stocks).
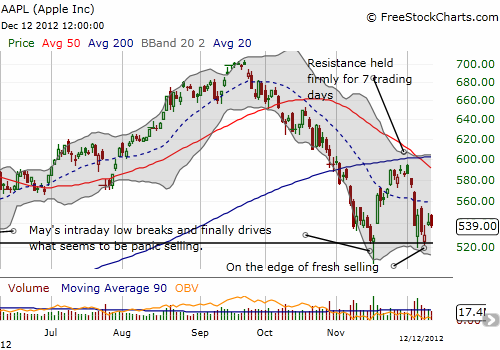
Despite Apple’s great year overall, it continue to miss out on these increasing pockets of bullishness.
The chart below shows Apple is struggling to hold onto support. As I mentioned in a previous T2108 Update, such a rapid retest of support rarely ends well (that is anecdotal). The stock has essentially gone nowhere in 5 trading days in what I am calling on twitter “churn and burn.” This churn and burn has Apple swinging wildly, sucking in traders to follow the momentum, only to burn traders who overplay the move. This is a perfect environment for options sellers to rake in massive amounts of premiums. On an intraday basis, the moves seem dramatic, but pull back a bit and you see the stock is actually going nowhere. Eventually, a fresh sustained move will erupt, but it is hard to tell exactly when or how.
This churn and burn is my motivation behind trading in multiple call and put spreads at different expirations. The difficult element of the trade is knowing when it makes sense to close out the short side of the spread to maximize exposure to the next sustained move. Given expiration of the weeklies is just two days away, I have closed the short sides of the spreads coming up for expiry. Given the churn, I will be locking in any profits relatively quickly.
Daily T2108 vs the S&P 500

Black line: T2108 (measured on the right); Green line: S&P 500 (for comparative purposes)
Weekly T2108

*All charts created using freestockcharts.com unless otherwise stated
Related links:
The T2108 Resource Page
Expanded daily chart of T2108 versus the S&P 500
Expanded weekly chart of T2108
Be careful out there!
Full disclosure: long FCX; long AAPL shares, call and put spreads; long JKS
