(T2108 measures the percentage of stocks trading above their respective 40-day moving averages [DMAs]. It helps to identify extremes in market sentiment that are highly likely to reverse. To learn more about it, see my T2108 Resource Page. You can follow real-time T2108 commentary on twitter using the #T2108 hashtag. T2108-related trades and other trades are posted on twitter using the #120trade hashtag)
T2108 Status: 53.7%
VIX Status: 17.1
General (Short-term) Trading Call: Hold (assuming at least some profits from oversold trade already locked. Otherwise, sells some)
Reference Charts (click for view of last 6 months from Stockcharts.com):
S&P 500 or SPY
SDS (ProShares UltraShort S&P500)
U.S. Dollar Index (volatility index)
VIX (volatility index)
VXX (iPath S&P 500 VIX Short-Term Futures ETN)
EWG (iShares MSCI Germany Index Fund)
CAT (Caterpillar)
Commentary
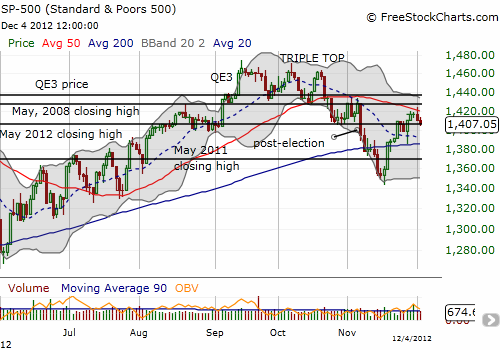
The S&P 500 followed through on Monday’s selling right at 50DMA resistance. It is now resting again at the May, 2012 closing high.

T2108 barely drifted lower from Monday’s level and remains near 2-month highs. At current levels, there are no T2108 trades, but as mentioned in the previous update, this is a time to lock in profits from buying when T2108 was oversold. The market needs to prove its strength by breaking resistance, and there is no need to risk profits in the process.
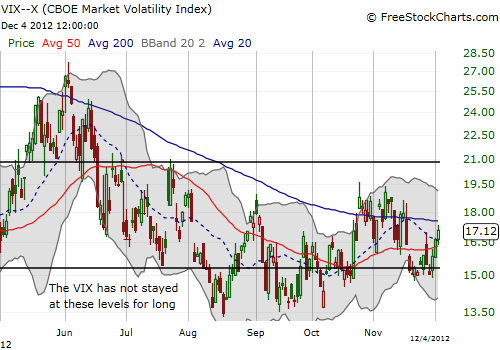
The most interesting technical development has come from the volatility index, the VIX. It has managed to rise for three straight days as the S&P 500 struggles against resistance. This COULD be a sign of a big move to come soon, up or down. The VIX has not risen for three straight days since August when the S&P 500 drifted lower before surging into a strong September.

It is VERY important to consider the upside potential of this move because the volatility index has been so lackluster for so long that almost any spike could be considered an out-sized display of fear in a relative sense.
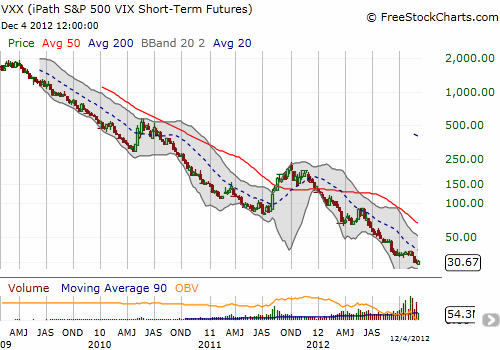
On November 23rd, Bernie Schaeffer from Schaeffer’s Investment Research appeared on Nightly Business Report to talk volatility. He noted that the bets on higher volatility have become the biggest disasters of the year. Readers will note that I learned my lesson earlier in the year and stopped using iPath S&P 500 VIX ST Futures ETN (VXX) as a way to bet on overbought market conditions. The irony is that the chart of VXX tells you everything you need to know about which way to bet.

Schaeffer called out VXX for its tremendous decline this year and poses the question: is there a lot less fear now or was the whole trade overdone? He sits on the side of overdone as he notes that the stock market’s decline over the summer (I think he really meant May) motivated traders to move out of puts on the S&P 500 and into calls on the VIX. These traders likely started to have visions of a super-spike in VIX. He does not think the market is complacent, but it is/was over-exuberant on the volatility trade. As an example, the stock market decline post-election generated very little movement in volatility. In fact, volatility increased the next day, and it has not traded higher ever since!
Moving forward, Schaeffer is extremely bullish on the market as he anticipates the disastrous trades on volatility will soon reverse themselves by going long the stock market. He also cites historically low exposure to stocks in pension funds and relatively high short positions on individual stocks. All this “tinder” just needs a catalyst to set it ablaze. He is purchasing June $140 calls on SPY. I obviously like this trade a lot better once (if?) we get another sell-off/pullback in the S&P 500.
Here are two related quotes from a related piece Schaeffer wrote on November 15th:
“I’d suggest the biggest stock market disaster of 2012 has been the utter demolition of the growing contingent of big-money investors who use call options on the CBOE Volatility Index (VIX) to hedge the downside risk in their portfolios. And I’d also suggest this demolition has had a non-trivial negative impact on the performance of hedge funds this year, whose generally mediocre results have put a crimp in the returns of such entities as pension funds.”
“A ‘hedge’ is not in reality a hedge when both legs of the trade lose money. And the fact that many big players have been long the market in recent weeks only because they felt their downside was protected by their VIX call positions has served to exacerbate the market’s weakness, as many of these low conviction longs are forced by these circumstances to pare down their stock positions.”
In that piece, Schaeffer includes a chart demonstrating the incredible surge in open interest on VIX call options starting from 2011 and picking up steam in 2012 (click link to review). All the while VIX has generally failed to respond much, or not nearly as expected, even when the market did decline.
Over the past few months, I have changed my trading tactic on VXX to buy shares “just in case” it somehow goes on one of its rare runs, but then marry those shares to puts which, as you can guess from the above chart, can be cashed in for profits on a regular basis. At some point, these put options should fail bigtime, but at that point I am hoping there is still meat left on VXX to make good profits on the shares. Stay tuned for updates on this trade.
Daily T2108 vs the S&P 500

Black line: T2108 (measured on the right); Green line: S&P 500 (for comparative purposes)
Weekly T2108

*All charts created using freestockcharts.com unless otherwise stated
Related links:
The T2108 Resource Page
Expanded daily chart of T2108 versus the S&P 500
Expanded weekly chart of T2108
Be careful out there!
Full disclosure: long SSO calls, long VXX shares and puts
