(T2108 measures the percentage of stocks trading above their respective 40-day moving averages [DMAs]. It helps to identify extremes in market sentiment that are highly likely to reverse. To learn more about it, see my T2108 Resource Page. You can follow real-time T2108 commentary on twitter using the #T2108 hashtag. T2108-related trades and other trades are posted on twitter using the #120trade hashtag)
T2108 Status: 56.1%
VIX Status: 15.1
General (Short-term) Trading Call: Hold (lock in some profits as a precaution given resistance and overbought stochastics)
Reference Charts (click for view of last 6 months from Stockcharts.com):
S&P 500 or SPY
SDS (ProShares UltraShort S&P500)
U.S. Dollar Index (volatility index)
VIX (volatility index)
VXX (iPath S&P 500 VIX Short-Term Futures ETN)
EWG (iShares MSCI Germany Index Fund)
CAT (Caterpillar)
Commentary
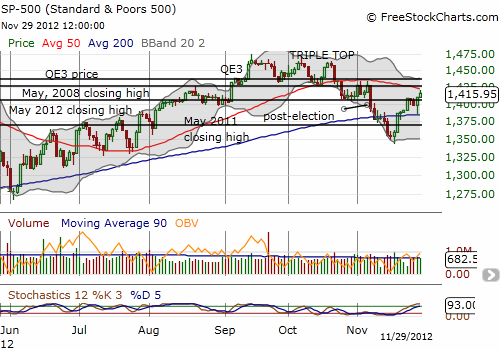
Today’s gains on the S&P 500 were only 0.43% yet T2108 soared another 8 percentage points to 56.1%. In T2108 terms, the market is no longer a bargain, but it is not yet time to get bearish either. Having said that, the S&P 500 has rallied to a precarious point. Resistance at the 50DMA looms directly overhead just as stochastics have flipped to overbought status.

This combination of resistance and overbought stochastics should prove to be a near-term bearish signal. Seeing this setup motivated me to sell my last SSO shares as a precaution even though today marked a bullish signal from the Black Friday trade. With seven calendar days behind us since Black Friday, the odds are now extremely high that the S&P 500 will proceed for weeks, perhaps months, without closing at a point that reverses the gains from Black Friday. The lows from that day, around 1391, now form presumed support for trading going forward. This level is made all the more convenient given the 200DMA rests directly below.
Of course, printing firm support says nothing about the gains we can expect in the near-term. I fully expect a pullback as early as Friday and certainly by Monday. This selling should relieve the S&P 500 of its overbought conditions enough such that the next buying opportunity opens up. Eventually, 50DMA resistance will give in as the bullish tone for the Black Friday trade suggests we should expect T2108 overbought conditions to arrive within the next few weeks. As always, we will take this one step at a time.
Daily T2108 vs the S&P 500

Black line: T2108 (measured on the right); Green line: S&P 500 (for comparative purposes)
Weekly T2108

*All charts created using freestockcharts.com unless otherwise stated
Related links:
The T2108 Resource Page
Expanded daily chart of T2108 versus the S&P 500
Expanded weekly chart of T2108
Be careful out there!
Full disclosure: long SSO calls, long VXX shares and puts
