(T2108 measures the percentage of stocks trading above their respective 40-day moving averages [DMAs]. It helps to identify extremes in market sentiment that are highly likely to reverse. To learn more about it, see my T2108 Resource Page. You can follow real-time T2108 commentary on twitter using the #T2108 hashtag. T2108-related trades and other trades are posted on twitter using the #120trade hashtag)
T2108 Status: 48.1%
VIX Status: 15.5
General (Short-term) Trading Call: Hold (Bullish bias remains)
Reference Charts (click for view of last 6 months from Stockcharts.com):
S&P 500 or SPY
SDS (ProShares UltraShort S&P500)
U.S. Dollar Index (volatility index)
VIX (volatility index)
VXX (iPath S&P 500 VIX Short-Term Futures ETN)
EWG (iShares MSCI Germany Index Fund)
CAT (Caterpillar)
Commentary
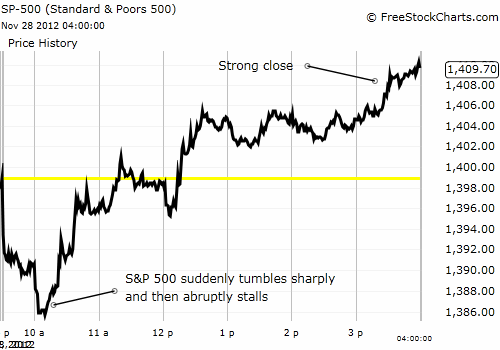
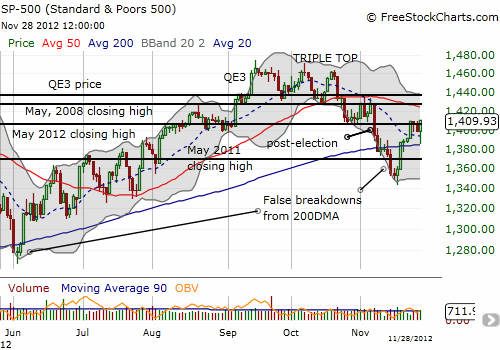
The oversold bounce continues as the S&P 500 staged an impressive turn-around that transformed into a successful (and significant) retest of its 200DMA. T2108 surged another 9 percentage points to 48.1%, almost a new high for the month. While the close for the day was strong, the market opened weakly in ominous fashion.
Shortly after 10am Eastern, the S&P 500 (SPY) fell over a cliff and tumbled towards its 200-day moving average in just a few minutes time. Suddenly, headlines circulated that House Majority Leader John Boehner made statements indicating his party is ready to cut a deal with the President and Democrats to avert sending the economy over a Fiscal Cliff. The stock market’s response printed an 180 degree turn-around.


As I like to say, you just cannot make this stuff up. Sheer coincidence that the S&P 500 retested the 200DMA around the time of Boehner’s statement? We will never know. But the timing was at least convenient. The bounce that confirmed the 200DMA support was strong but quite strong enough to pull the S&P 500 away from the resistance it has battled since last week’s Black Friday rally. This resistance coincides with the closing high from May of this year.
Today’s sharp swing was a reminder that Fiscal Cliff headlines can disrupt market trading at anytime in any direction. The previous day, proclamations from Senate Majority Leader Harry Reid were blamed for sending the S&P 500 to a poor close that set up the bearish open for Wednesday’s trading.
The end result of two days of Fiscal Cliff headlines is a market that net-net has generated a lot of intraday excitement but gone nowhere, a great reminder of the frequent futility of headline-driven trading when quick trigger emotions are running high. The most important impact of the Boehner’s market save and 200DMA test is that the bullish Black Friday trade I discussed earlier this week remains intact. As a reminder, if the S&P 500 CLOSES Thursday without erasing all of the gains from Black Friday’s impressive rally (6th strongest since 1950), the odds become exceptionally good the S&P 500 can sustain gains for several more weeks and perhaps even months ahead.
At its lows on Wednesday, the S&P 500 had erased all of Black Friday’s gains, so anyone playing the bearish version of the Black Friday trade – most years, Black Friday’s gains are completely erased by Thursday’s close and often by Monday’s close – could have declared mission accomplished and cashed out short positions. Instead, the sharp rebound avoids the bearish lower close and keeps the bullish version of the trade alive for now.
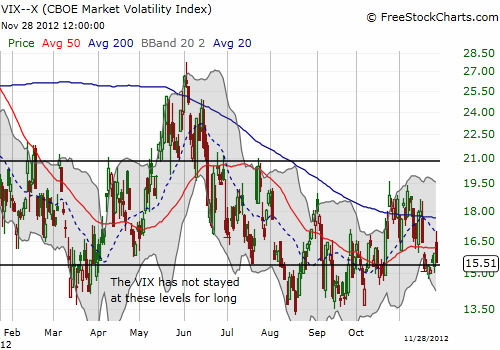
As the market trudges higher, the volatility index (VIX) continues to show little to no overall dread about the Fiscal Cliff. However, a BIG caveat is that to-date the VIX has also not spend much time down at current levels.

Source for charts: FreeStockCharts.com
Combine a tame VIX with a T2108 on the rise and an S&P 500 successfully retesting 200DMA support, all within the context of the Black Friday trade, suddenly the market looks a lot more bullish than I had expected at this point.
Daily T2108 vs the S&P 500

Black line: T2108 (measured on the right); Green line: S&P 500 (for comparative purposes)
Weekly T2108

*All charts created using freestockcharts.com unless otherwise stated
Related links:
The T2108 Resource Page
Expanded daily chart of T2108 versus the S&P 500
Expanded weekly chart of T2108
Be careful out there!
Full disclosure: long SSO calls, long VXX shares and puts
