(T2108 measures the percentage of stocks trading above their respective 40-day moving averages [DMAs]. It helps to identify extremes in market sentiment that are highly likely to reverse. To learn more about it, see my T2108 Resource Page. You can follow real-time T2108 commentary on twitter using the #T2108 hashtag. T2108-related trades and other trades are posted on twitter using the #120trade hashtag)
T2108 Status: 38.2%
VIX Status: 17.8
General (Short-term) Trading Call: Hold (consider closing shorts – bias is bearish)
Reference Charts (click for view of last 6 months from Stockcharts.com):
S&P 500 or SPY
SDS (ProShares UltraShort S&P500)
U.S. Dollar Index (volatility index)
VIX (volatility index)
VXX (iPath S&P 500 VIX Short-Term Futures ETN)
EWG (iShares MSCI Germany Index Fund)
CAT (Caterpillar)
Commentary
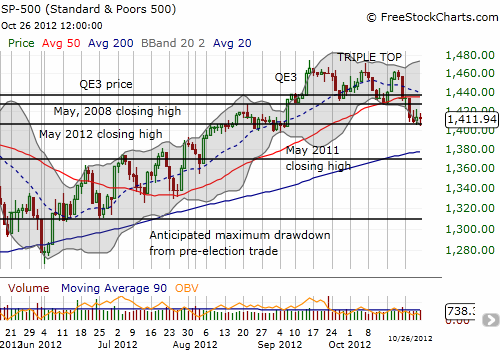
Over the last four trading days, the S&P 500 has flirted with critical support at the May, 2012 closing high. The S&P 500 broke down from 50DMA support the day before the Federal Reserve’s latest statement on monetary policy. That statement provided no solace for an index teetering on the edge of a new breakdown.

T2108 finished the week at its own edge. At 38.2%, T2108 is at levels last seen in late June. It too is teetering on a fresh breakdown to what will likely be oversold levels by the end of the week if the S&P 500 breaks support.
The VIX held steady above its 200DMA for the first time since early June. The volatility index remains below the levels that started 2011’s swoon, and I suspect this level will continue to act as firm resistance for the VIX without a large, new catalyst.
My bias remains bearish, but I am not aggressively bearish. I expect the stock market to largely go nowhere net-net through the end of the year, so I do not anticipate getting aggressive about any position without a stock-specific case for doing so (like earnings and technical support/resistance). If T2108 manages to flip to oversold, I will get aggressive in buying assuming that such a move comes amidst a healthy-sized sell-off.
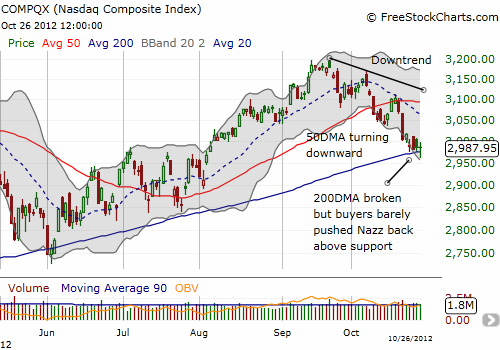
In the meantime, I continue to observe and record the market’s response to earnings, especially for tech stocks. It is in tech where the technicals (pun not intended!) look worst. Many tech stocks have broken down, and, as I noted in “Lessons Learned As Apple Earnings Deliver Dream For Options Sellers“, the NASDAQ (QQQ) is teetering on critical support at the 200DMA. If the NASDAQ breaks (closes below the 200DMA and follows through), then we should raise a bright red warning flag. Here is an update on the NASDAQ chart:

Note well how the NASDAQ cleaved right through the 50DMA earlier this month and neatly failed at the 50DMA on its attempted bounce back. Add in a 50DMA which is starting to turn downward, and we get an index that is teetering on the edge of a fresh and major breakdown. On the flip side, if the NASDAQ manages to rally from here, say prints a close above last week’s high, then it should be OK to play a continued rally at least back to the 20 or 50DMA resistance levels.
Daily T2108 vs the S&P 500

Black line: T2108 (measured on the right); Green line: S&P 500 (for comparative purposes)
Weekly T2108

*All charts created using freestockcharts.com unless otherwise stated
Related links:
The T2108 Resource Page
Expanded daily chart of T2108 versus the S&P 500
Expanded weekly chart of T2108
Be careful out there!
Full disclosure: long SSO calls, long VXX shares and puts
