Google (GOOG) reports earnings tonight (October 18th). I ran out of time for running my “earnings trade template,” but I wanted to take a few minutes to post some interesting observations on GOOG options. These may become good references for the next round of earnings. (See “Chipotle Bears Ready For Another Poor Earnings Performance But Watch Pre-Earnings Close” for my most recent example of the earnings trade template. Click here for some archives).
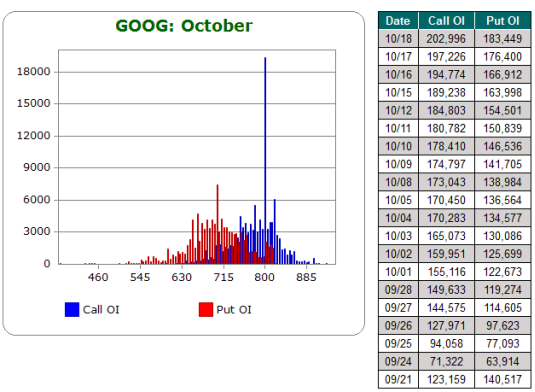
The most notable characteristic of GOOG options is the SWELL of open interest on calls at the $800 strike. At the time of writing (Thursday morning), open interest sits at 19,326. I believe this is a drop of about 2,000 options I believe from the previous day (I tweeted about this earlier), but it represents the largest block of open interest by far on any strike, calls or puts. This chart from Schaeffer’s Investment Research makes the picture plain.

Source: Schaeffer’s Investment Research (open interest configuration)
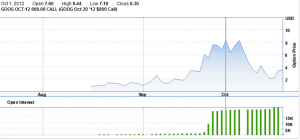
Normally, I might interpret this swell as a bullish anticipation of GOOG earnings with the stock trading under $800. However, it turns out that the bulk of this open interest was likely bought at much higher prices. Moreover, the bulk of the run-up in open interest happened from September 25-26 when GOOG finally broke to new all-time highs, a level not seen since 2007. In other words, traders were either chasing GOOG’s stock after a tremendous run-up and/or market makers or big holders of GOOG stock rushed out to sell premium while the getting was good. Over this time, the Oct $800 calls ran up in price from $6.00 to $7.60. It peaked a few days later on October 1st at $8.30 (with a high of $9.44). Here is the chart of open interest for the Oct $800 call:
Click chart for larger view…

Source: Etrade
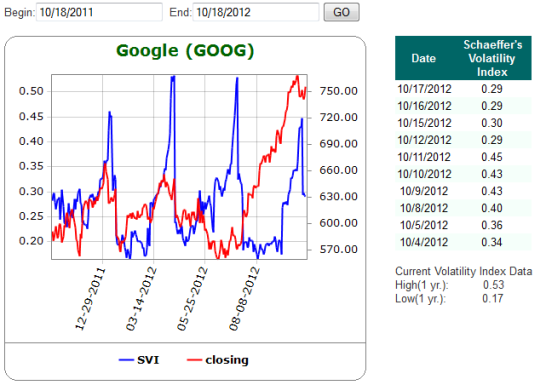
I placed the orange cursor on the peak at October 1st for reference. Since that peak, these calls have lost about 60% of their value. This decline in value has been aided by a surprising plunge in implied volatility going into earnings. This plunge hurt my own play on pre-earnings with a strangle ($705 puts and $780 calls); I put a small dent in the losses by selling options around the strangle (currently still sitting on a short $810 call that I will close before the end of the day for at least a small profit).

Source: Schaeffer’s Investment Research (Schaeffer’s Volatility Index)
The periodic sharp swings in volatility are all related to earnings. After zooming into those dates, I discovered that GOOG’s volatility has fallen before earnings in other instances. For example, this happened for January and July earnings of this year, but not for April earnings. This is yet another lesson for checking data before trading on an assumption!
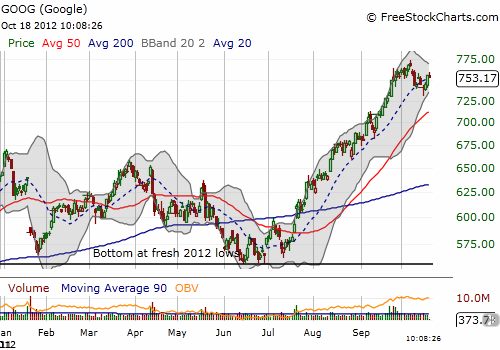
GOOG is currently bouncing back from a large one-day sell-off on October 9th that took the stock to and through its 20-day moving average for the first time since July, the beginning of this remarkable run-up. The stock has churned for the past week since then, never quite recovering those losses. The chart now looks like a coiled spring for earnings.

Source: FreeStockCharts.com
I am VERY surprised that traders have not closed out more of the calls at the $800 strike with so much money made from selling them. In fact, before today, open interest actually increased to new highs in the previous two days. Beyond that, it seems these calls have experienced very little turnover even as their value plummeted. This sets up for a very interesting tension at the $800 strike. I am expecting GOOG to trade right to or just above $800 (like $810) if GOOG delivers results that the market likes. If GOOG plunges post-earnings, I will have to assume that the sellers who stock by their positions all this have ice in their veins and REALLY know their stuff. Either way, the mystery at $800 will soon be solved for Google.
Be careful out there!
Full disclosure: long GOOG call spread and GOOG puts

The earnings plunge is related to a roll-over to November options. GOOG usually reports during expiration week and that is why you see these volatility decreases. For example, Oct. options are price at 45%, whereas November options are priced at 28%. We roll these out the Monday of expiration week.
Per comment above, I am referring to the implied volatility plunge.
So you do the roll-over BEFORE earnings? And why is the pattern not consistent? At some point, I will pull out more data points to look for any patterns or correlations with subsequent price action. But getting the data is very manual….
And that is why smart money is not to be feared. It is also why high amounts of calls are bearish and puts bullish. Having those $800 and $810 Nov’s was bearish for the stock. It was going to stop GOOG in its tracks. It did.
It is a lesson I am duly noting. I think context was important. The surge in calls happened as GOOG hit all-time highs, a sure sign of chasing momentum for momentum’s sake.