(T2108 measures the percentage of stocks trading above their respective 40-day moving averages [DMAs]. It helps to identify extremes in market sentiment that are highly likely to reverse. To learn more about it, see my T2108 Resource Page. You can follow real-time T2108 commentary on twitter using the #T2108 hashtag. T2108-related trades and other trades are posted on twitter using the #120trade hashtag)
T2108 Status: 55.4%
VIX Status: 15.2
General (Short-term) Trading Call: Hold
Reference Charts (click for view of last 6 months from Stockcharts.com):
S&P 500 or SPY
SDS (ProShares UltraShort S&P500)
U.S. Dollar Index (volatility index)
VIX (volatility index)
VXX (iPath S&P 500 VIX Short-Term Futures ETN)
EWG (iShares MSCI Germany Index Fund)
CAT (Caterpillar)
Commentary
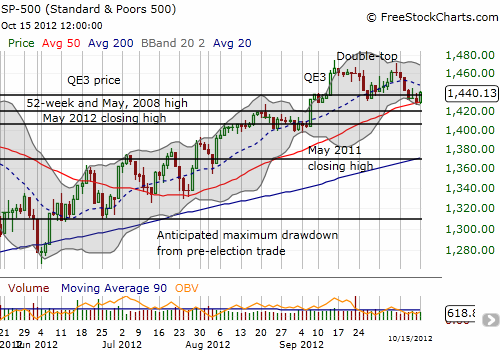
As I always say, you just can’t make this stuff up. The S&P 500 bounced perfectly off its 50DMA for what I call an “obligatory bounce.” The market’s movements are in such slow motion that it was relatively easy for technical traders to move the index off natural support.

The bears may have just lost their best chance to knock the market down. As I type, the U.S. dollar is weakening with even the Australian dollar rallying despite what looks like the Reserve Bank of Australia’s promise to continue lowering interest rates. Combine that with Asian stock markets opening strong and plenty of fuel is built up for a strong open on the U.S. markets. Given the double-top and the mild downtrend in place, it is also too soon to rekindle a bullish twinkle in the eye, but I always take note when one side or the other loses a golden opportunity to prove its point. Now, it is the turn of the bulls.
T2108 bounced to 55.4%. It is not yet in a position to tell us much except that a lot of stocks have recently broken down from nice support levels.
Given it is earnings season, I will try to keep these updates short since some announcement somewhere can immediately turn the technical picture on its head.
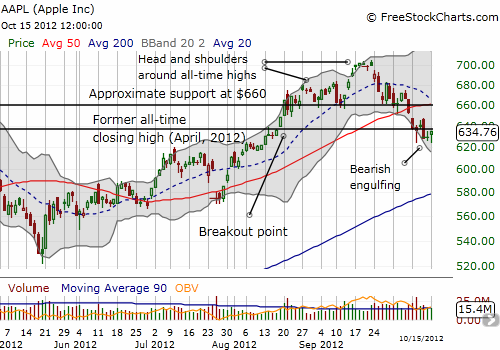
I conclude with an “obligatory” chart of Apple (AAPL). The bears tried to break the stock as AAPL printed relative under-performance compared to the S&P 500. However, the sellers could not follow through. AAPL held at 2-month lows and even rallied directly into what is now key resistance around $636. If AAPL manages to close above this level, then I think it trades to $660 relatively quickly as long as the general market remains in a good mood. Remember that earnings are next week, October 25th; hedge funds and the like are now jockeying for position….

Daily T2108 vs the S&P 500

Black line: T2108 (measured on the right); Green line: S&P 500 (for comparative purposes)
Weekly T2108

*All charts created using freestockcharts.com unless otherwise stated
Related links:
The T2108 Resource Page
Expanded daily chart of T2108 versus the S&P 500
Expanded weekly chart of T2108
Be careful out there!
Full disclosure: no positions!
