(T2108 measures the percentage of stocks trading above their respective 40-day moving averages [DMAs]. It helps to identify extremes in market sentiment that are highly likely to reverse. To learn more about it, see my T2108 Resource Page. You can follow real-time T2108 commentary on twitter using the #T2108 hashtag. T2108-related trades and other trades are posted on twitter using the #120trade hashtag)
T2108 Status: 70.2% (3rd day of overbought period)
VIX Status: 15.1
General (Short-term) Trading Call: Hold
Reference Charts (click for view of last 6 months from Stockcharts.com):
S&P 500 or SPY
SDS (ProShares UltraShort S&P500)
U.S. Dollar Index (volatility index)
VIX (volatility index)
VXX (iPath S&P 500 VIX Short-Term Futures ETN)
EWG (iShares MSCI Germany Index Fund)
CAT (Caterpillar)
Commentary
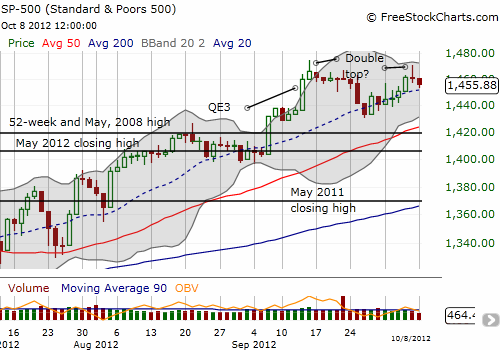
These overbought periods are really getting “boring.” T2108 is exactly where I left it the day before the September unemployment report, right at the border of overbought territory. In that T2108 Update, I stated that the market would react well to the unemployment report based on the technicals going in. I was right about the open, and, as planned, I unloaded the rest of my SSO calls into the strong open. However, as the day wore on, the S&P 500 quickly lost steam. After a brief dip into negative territory, the index closed flat. This fade pattern formed a long wick in the immediate vicinity of the 52-week (and multi-year) high.
Today’s follow-through selling flags a potential double-top in the making…EXCEPT the current uptrend remains well intact. In fact, today’s close rested comfortably on top of the 20DMA which has well-defined the uptrend since the June low. The chart below zooms in on the current neutral setup.

So, the bears still have proved nothing. However, note that the upward sloping 50DMA is becoming more and more important to the technical health of the S&P 500. Cracking this support in the near-term would mark a second complete erasure of QE3 gains as well as a lower low that would signal the end of the current uptrend. Once again, I am not interested in shorting this market until such a sign of fissure gets confirmed.
In the meantime, I decided to buy a small handful of SSO calls into today’s weakness as a play on the 20DMA support. I will sell these into the very next rally.
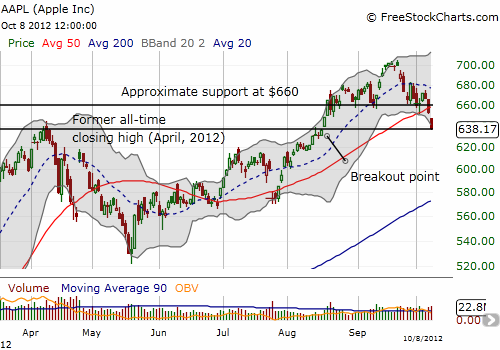
While the general stock market is holding up well, Apple (AAPL) seems to be breaking down fast. AAPL’s 2.2% loss today was uncharacteristic for a Monday and showed major relative weakness. Worst of all, the decline marked a clean gap down from the 50DMA and previous support at $660. The 20DMA is turning downward for the first time since the May swoon. Next up is the most critical support in a long time: the former all-time high at $636 that also marks the breakout point from August. The chart below shows how AAPL stopped cold right above this support. A close below this support puts AAPL’s primary uptrend in jeopardy and flips the near-term technical outlook from bullish to bearish.

Astute technicians will also notice that AAPL’s gap down has formed a small head and shoulders (H&S) pattern around the current all-time high. This pattern is particularly ominous, but I do not give it as much weight as the breakdown itself. The shoulders of the H&S pattern are at $680. Only if/when AAPL re-hurdles that level, will it return to (short-term) bullish territory.
Daily T2108 vs the S&P 500
Click chart for extended view with S&P 500 fully scaled vertically (updated at least once a week)

Black line: T2108 (measured on the right); Green line: S&P 500 (for comparative purposes)
Weekly T2108

*All charts created using freestockcharts.com unless otherwise stated
Related links:
The T2108 Resource Page
Expanded daily chart of T2108 versus the S&P 500
Expanded weekly chart of T2108
Be careful out there!
Full disclosure: long SSO calls, long AAPL call
