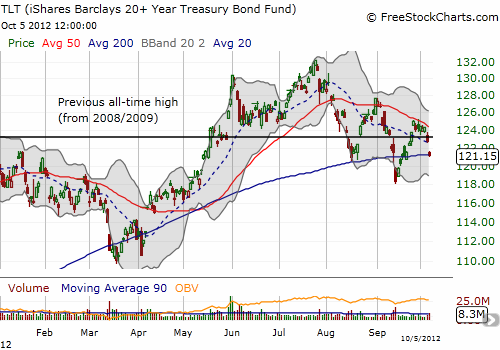
The Federal Reserve’s expressed desire for quantitative easing and Operation Twist has been to lower long-term interest rates. The response to the announcement of QE3 on September 13th has not yet generated lower interest rates except for a brief moment. The iShares Barclays 20+ Year Treasury Bond Fund (TLT) is one way to play long-term interest rates; it rises as rates go lower and falls as rates go higher. TLT closed Friday essentially flat with the close on September 13th. TLT also closed right at its 200-day moving average (DMA) and continued a trend of lower highs and lower lows since the all-time high on July 25th.

Source: FreeStockCharts.com
At the last two dips, I bought TLT calls as a quasi-hedge on stocks. Both trades worked out well as I sold them when TLT hit resistance at the declining 50DMA. I am angling to make one more trade long on this current dip; I am waiting for a lower low in this downtrend. If I execute this trade, I am likely to sell the calls on a bounce to 200DMA resistance which should be declining by then. After that, I will leave TLT alone as the markets are entering a seasonally weak period for TLT (and seasonally strong period for stocks). It seems overall that since 2010 yields are not responding directly to Fed actions and instead are responding more to the cycles of fear and relief over macro-economic conditions.
Be careful out there!
Full disclosure: no positions
