For the first time in over two months, Apple (AAPL) closed the week on a down note with a loss on Friday. These two months stand out because AAPL has tended to close the week meekly (Thursday and Friday) since 2010. Not only did this past Friday break a 9-week winning streak, but also the 2.1% loss was Apple’s worst close for a week since a 2.9% loss on June 1st when the overall stock market hit bottom for the year.
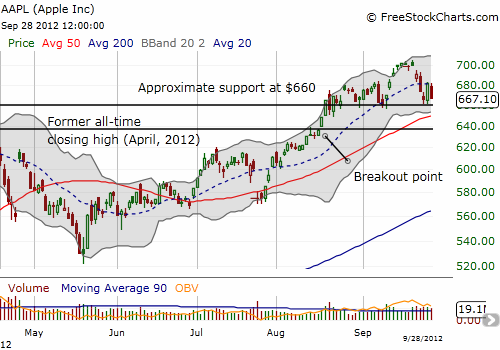
Apple (AAPL) is up 65% year-to-date, but it is only up 5% since the former all-time closing high of $636 set in April. AAPL has essentially gone nowhere over the past five weeks. In the chart below it seems clear that $660 has become an important point of support as AAPL has repeatedly refused to close below this line. With the 50-day moving average (DMA) rapidly rising, a critical test of support is likely to occur that could determine whether AAPL regains its upward momentum or begins some kind of correction.

Source: FreeStockCharts.com
These past five weeks (24 trading days) are special not just because of Apple’s flat overall performance but also because it just so happens that I devised a guide to day-to-day trading in Apple right before this period. This guide demonstrated Apple’s performance under different scenarios and in different timeframes. The most interesting general pattern was for AAPL to start the week strong and end meekly. As noted above, during these last five weeks, the patterns have changed slightly (go figure).
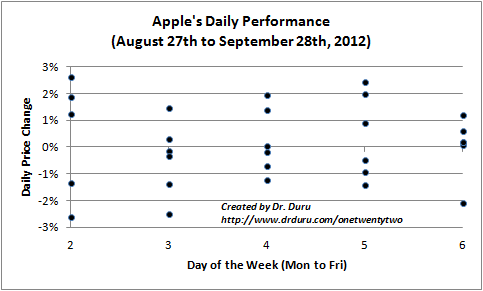
First, here is a chart showing Apple’s daily performance over the past five weeks. Note the large number of days where Apple gains or loses at least 1% and even 2%; sixteen of the twenty-four trading days (67%) have featured these large swings all the while producing a net zero gain for the stock. Each point in the chart is the daily price change for a given day of AAPL trading. (Due to limitations in Excel, I had to leave the x-axis numbered: 2 represents Monday and 6 represents Friday).

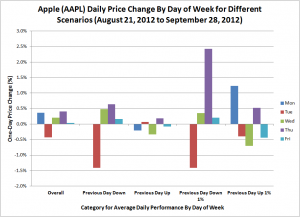
AAPL still generally starts the week with a relatively strong Monday and a relatively weak Friday. However, Tuesday has become a day for erasing Monday’s gains and Thursday has become the strongest day of the week. This switch in trading patterns has also changed the timing of buying dips in AAPL. Now, Tuesday tends to deliver follow-through selling if Monday is down. The chart below combines all the observations on average daily price change under different scenarios. Note that Monday is blank for the down scenarios because every preceding Friday in this 5-week period printed a positive gain.
Click for a larger view…

Source for price data: Yahoo! Finance
Observing this change in behavior is an important reminder that the prevailing trend (or lack of one) can influence the general patterns in daily trading (for AAPL at least). I now intend to update this analysis more frequently than I originally thought was necessary. In the meantime, watch $660 and the 50DMA closely.
Be careful out there!
Full disclosure: long AAPL calls
