(T2108 measures the percentage of stocks trading above their respective 40-day moving averages [DMAs]. It helps to identify extremes in market sentiment that are highly likely to reverse. To learn more about it, see my T2108 Resource Page. You can follow real-time T2108 commentary on twitter using the #T2108 hashtag. T2108-related trades and other trades are posted on twitter using the #120trade hashtag)
T2108 Status: 70.4% (overbought day #1 after yesterday’s dip to 65.0% ended a 14-day overbought period)
VIX Status: 14.8
General (Short-term) Trading Call: Hold
Reference Charts (click for view of last 6 months from Stockcharts.com):
S&P 500 or SPY
SDS (ProShares UltraShort S&P500)
U.S. Dollar Index (volatility index)
VIX (volatility index)
VXX (iPath S&P 500 VIX Short-Term Futures ETN)
EWG (iShares MSCI Germany Index Fund)
CAT (Caterpillar)
Commentary
As a reminder, on Friday of last week I tweeted the following:
“Next week is last trading week for Q3. With $AUDUSD sagging I am thinking $SPY sells off to start week, rallies to end, goes nowhere overall”
The S&P 500 sold off Monday through Wednesday before rallying today 0.96%. It will take another such rally to bring this week to even.
In between this action, T2108 dropped out of overbought conditions on Wednesday to 65.0%. That capped the last overbought period at 14 days. It was a milder and meeker overbought session than I expected. The overbought period ended exactly where it began. The ending managed to erase all the gains from QE3’s official announcement on September 13th. The maximum gain was 3.0% where the S&P 500 made a fresh 52-week and near 5-year high on September 14th (more on the significance of that day in another post). The market delivered very few buyable dips during this period and thus even fewer selling opportunities. Overall, the extended overbought strategy worked to about even but would have been greatly profitable if I had managed to hold my SSO calls longer on QE3 day.
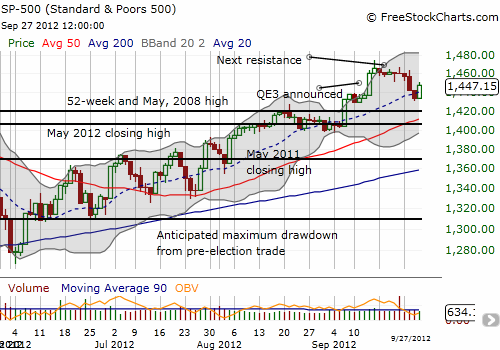
After T2108 dropped from overbought status AND the S&P 500 erased the QE3 gains, I officially ended the extended overbought strategy – per my rules. However, with T2108 jumping right back into overbought territory, I am faced with a dilemma. Do I interpret this overbought period in the traditional way as a time to sell/short or do I trade as if the overbought period never ended? For now, I am content to let my current SSO trades run their case. That means I will sell these calls into the next rally (the calls expiring tomorrow are likely to go out worthless unless the S&P 500 does manage to close the week flat). I will reassess at that point. The chart below shows the S&P 500 has now created some overhead resistance.

Based on the lackluster action from the previous overbought period and the ability of the market to erase immediately QE3 gains in commodity currencies and the stock market, I strongly suspect October will also be lackluster. In between the bookends of the month, I expect a lot of drama, particularly since we are rolling into another earnings season and this one immediately precedes a major presidential election. The pre-election trade is also doing well with a 4.9% gain so far. This performance so far places this period as the third highest ranking pre-election trade (featuring an incumbent). It seems perfectly reasonable to expect the S&P 500’s pre-election performance has topped out here.
Having said all this, I am still inclined to buy dips until the uptrend from the bounce from June lows ends. I thought erasing QE3 gains would end the uptrend, but the chart above shows the 20DMA is serving as a good marker of the uptrend. The 20DMA has yet to decisively break. Even if it does break, the uptrending 50DMA is directly beneath that ready to catch the S&P 500 before it ends the uptrend with a lower low below September 6th’s big rally.
Daily T2108 vs the S&P 500
Click chart for extended view with S&P 500 fully scaled vertically (updated at least once a week)

Black line: T2108 (measured on the right); Green line: S&P 500 (for comparative purposes)
Weekly T2108

*All charts created using freestockcharts.com unless otherwise stated
Related links:
The T2108 Resource Page
Expanded daily chart of T2108 versus the S&P 500
Expanded weekly chart of T2108
Be careful out there!
Full disclosure: long SSO calls
