(This is an excerpt from an article I originally published on Seeking Alpha on August 19, 2012. Click here to read the entire piece.)
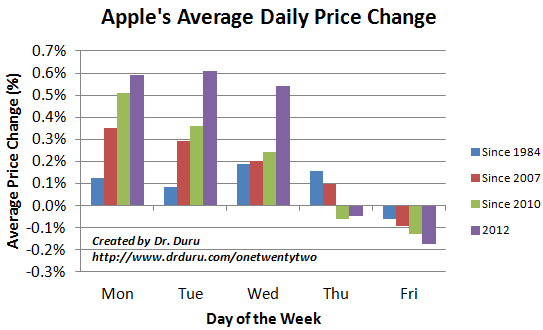
{snip} AAPL has developed a pattern where, on average, it starts the week strong and ends meekly. The following chart shows the average daily return for AAPL for each day of the week over different time frames.
{snip}
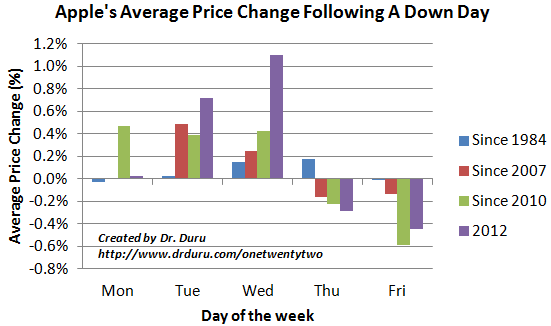
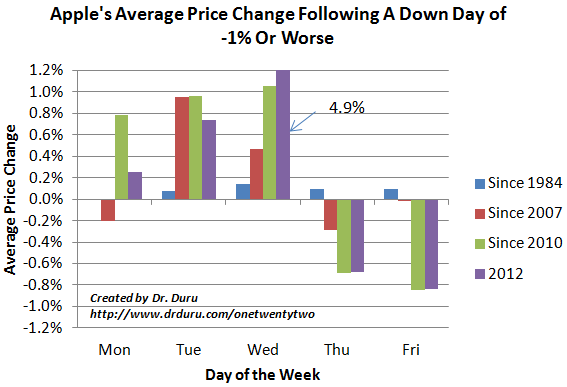
This view came from a discussion I had with a friend about Apple’s apparent tendency to start the week with exceptionally strong performances. He confirmed my anecdotal observations with some data on Mondays over the past several months. Next, I applied my template for examining the daily performance patterns of the S&P 500 (see “S&P 500 Performance By Day Of Week And The Changing Nature Of Trading Tuesdays“) to AAPL. The interesting patterns did not end with the average daily performance.
{snip}
{snip}
{snip}
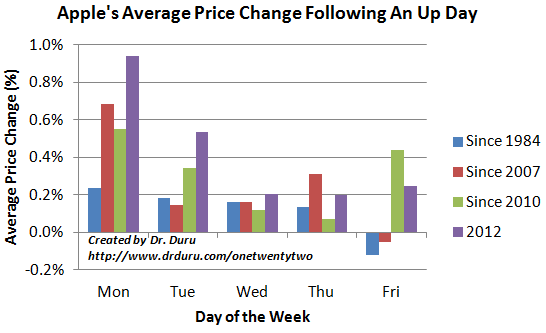
Source of price data for all charts: Yahoo!Finance
{snip}
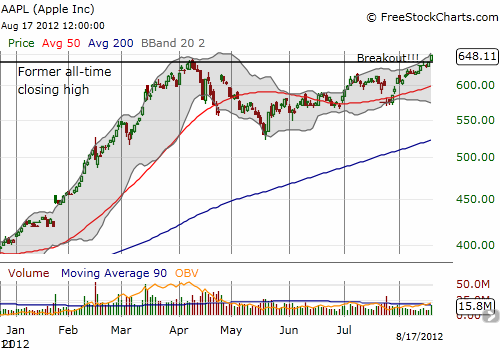
I think these data matter most for the numerous traders buying and selling Apple’s options, especially the weeklies. I believe Apple’s high stock price encourages more trading in options. {snip}
Source: FreeStockCharts.com
{snip}
The heavy trade in call options seem to make Apple’s launch to higher heights even more likely. The current surge in call buying volume is very similar to the surge that occurred near the beginning of Apple’s tremendous three-month run-up to start 2012…{snip}
Be careful out there!
(This is an excerpt from an article I originally published on Seeking Alpha on August 19, 2012. Click here to read the entire piece.)
Full disclosure: long AAPL shares (at time of posting)

Dr. Duru,
Would it be possible to get the daily averages of Apple’s Price Changes updated for 2013 and to date in 2014. You published the data through 2012 in your “A Guide For Day-to-Day Trading In Apple’s Stock”- August 25th, 2012. I find that data (now 24 months old) suggestive of some interweek swing trading and would like more up-to-day charts.
Thanks,
Lee
Yeah – this is an old post! Glad you tracked it down. I have greatly advanced my work on this to include a more systematic formulation that finds the exact kind of patterns you are sensing exist. See this link and let me know whether you need more: http://drduru.com/onetwentytwo/2014/06/01/apple-trading-model-update-end-of-era/