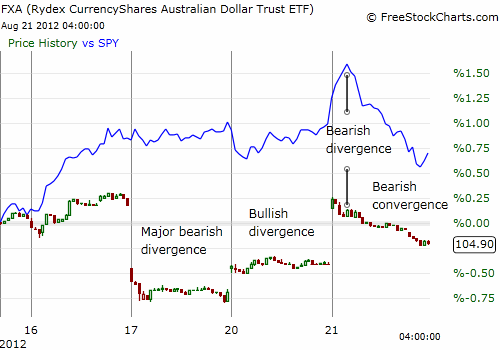
The Australian dollar (FXA) continues to provide a useful leading indicator of the likely direction of the S&P 500 from day-to-day and week-to-week. After pointing out the signs of a bearish divergence on Thursday, August 16th, a notable bearish divergence opened between the S&P 500 and the Australian dollar the following day. The Australian dollar gapped down significantly to open the U.S. trading session and never recovered. FXA lost 0.9%, closing near its lows on the day. The S&P 500 (SPY) managed a marginal gain on the day as it closed just under fresh 52-week and four-year highs.
What has followed from Friday is an interesting mix of signals, each time featuring a lead by the Australian dollar as I have come to expect. On Monday, August 20th, the Australian dollar’s gap up during the U.S. trading session contradicted the S&P 500’s race to lows from the open. Over the course of the day, the S&P 500 drifted upward and closed almost flat. What happened today, Tuesday, is perhaps even more significant than last week’s bearish divergence. Today, the Australian dollar – S&P 500 relationship quickly moved from bearish divergence to bearish convergence.
In the chart below, I use Rydex CurrencyShares Australian Dollar Trust ETF (FXA) instead of the currency pair AUD/USD to focus on the U.S. trading hours. I use a candlestick chart on FXA to clearly distinguish it from the solid line for the S&P 500. This format also helps emphasize the gaps from market close to open.

For today’s trading action, the S&P 500 surged to fresh 52-week and 4-year highs. FXA gapped up as well. However, it immediately sold off from the open while the S&P 500 quickly raced higher. In response, I tweeted the following:
“$AUDUSD has another bearish divergence from $SPY today. Not confirming impressive move to fresh highs. #forex”
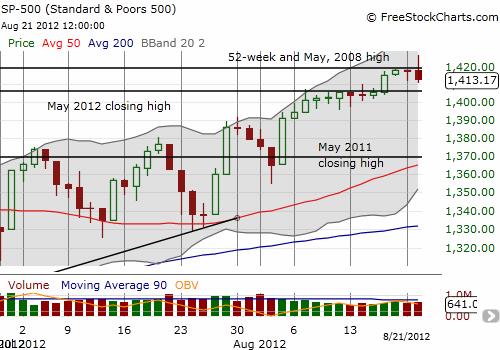
Sure enough, the S&P 500 topped out soon thereafter and proceeded to print its own very bearish pattern: a false breakout. (And, yes, in the chart below, those are really a bunch of May highs from this year and previous years.)

Source for charts: FreeStockCharts.com
I zoom in on the last seven weeks to make the false breakout clear. The S&P 500 broke out to fresh 52-week and four-year highs but faded into the close, ending the day BELOW the breakout line. This bearish pattern puts the onus on the buyers. A lower close within the next few days will pretty much confirm a topping pattern (see “Another Blow-Off Top for Yelp.com” for an excellent example of THREE such topping patterns in one chart).
The days going into the Labor Day weekend will be critical. I earlier expected the bearish divergence from last week to play out slowly over this time. If instead, the S&P 500 follows through so soon on a fresh bearish bias, such action will set up the stock market for a correction at least as big as the ones that have interrupted the index’s stair-step climb from the June lows. Note that the overall bullish bias remains as long as the next trading low remains above the last one. (Also see “A 5% Decline In The S&P 500 Within 3 Months Would Be A ‘Gift’“).
Be careful out there!
Full disclosure: long Australian dollar (versus euro and the British pound)
