(T2108 measures the percentage of stocks trading above their respective 40-day moving averages [DMAs]. To learn more about it, see my T2108 Resource Page. You can follow real-time T2108 commentary on twitter using the #T2108 hashtag. T2108-related trades and other trades are posted on twitter using the #120trade hashtag)
T2108 Status: 62.5%
VIX Status: 17.5 (confirmed rejection from 50DMA and point of breakout for summer 2011 swoon)
General (Short-term) Trading Call: Hold
Reference Charts (click for view of last 6 months from Stockcharts.com):
S&P 500 or SPY
SDS (ProShares UltraShort S&P500)
U.S. Dollar Index (volatility index)
VIX (volatility index)
VXX (iPath S&P 500 VIX Short-Term Futures ETN)
EWG (iShares MSCI Germany Index Fund)
CAT (Caterpillar)
Commentary
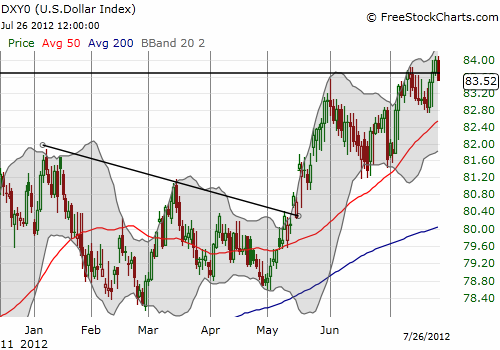
Today was a great reminder of why I am extremely reluctant to hold T2108 bearish positions for more than a day or two. The markets seemed set for a sleepy open until European Central Bank President Mario Draghi jawboned the markets in the classic style of a central banker: “‘Within our mandate, the ECB is ready to do whatever it takes to preserve the euro…believe me, it will be enough’…markets have underestimated the progress that’s been made in the euro area and that the monetary union is ‘irreversible.'” With that it was off to the races. The euro soared against the dollar and the dollar index was soundly rejected from its QE2 reference price (right after I just finished announcing the jump ABOVE that milestone!).

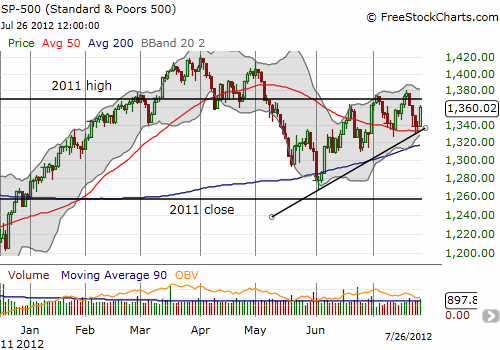
It was fascinating to see the S&P 500 soar 1.7% on positive news from euroland when it has performed exceptionally well even as the euro slowly but surely dripped lower. I did not attempt to fade the rally given the index had not yet run into major resistance. It is usually futile to fade a rally that is freshly bouncing off firm support like the 50DMA. Moreover, T2108 is not yet overbought (now at 62.6%).

The VIX dropped 9.4% in a move that confirms another rejection from 50DMA resistance and the line that defines the breakout point for 2011’s summer swoon. This dance has been unfolding nearly all year, and I am surprised this churn continues with no real resolution.
One of my disappointments on the day came from Siemens Atkins (SI) which strangely refused to participate in the day’s festivities. I purchased this contrary play specifically to profit from a day like today. SI “should have” bounced 3-5%. Caterpillar, Inc. (CAT) also failed to participate as it continues to perform the role of a canary in the coal mine. CAT responded poorly to earnings yesterday by completely fading its gap up. The stock faded again today from a small gap up and struggled to achieve its under-performing 0.9% gain. The 50DMA continues to cap CAT and drive it ever downward. The stock remains almost 10% down for the year.
Daily T2108 vs the S&P 500
Click chart for extended view with S&P 500 fully scaled vertically (updated at least once a week)

Black line: T2108 (measured on the right); Green line: S&P 500 (for comparative purposes)
Weekly T2108

*All charts created using freestockcharts.com unless otherwise stated
Related links:
The T2108 Resource Page
Expanded daily chart of T2108 versus the S&P 500
Expanded weekly chart of T2108
Be careful out there!
Full disclosure: long SDS; long VXX shares; short VXX call spreads; long VXX puts; long CAT, SI; net short euro
