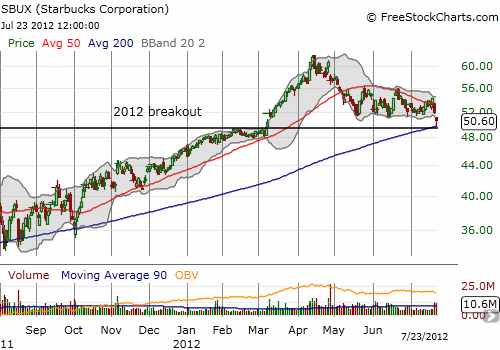
On July 23, Starbucks (SBUX) tested its 200-day moving average (DMA) for the first time since last October. This support held as the general stock market rallied into the close. This level also happened to coincide with SBUX’s breakout in March as SBUX moved on to fresh all-time highs.

Source: FreeStockCharts.com
If SBUX fails to hold this double support, the stock becomes a compelling short. Such a breakdown can lead to lasting and sustained selling as momentum begins to work against the stock. Even as SBUX struggles to hold on, the 50DMA is rapidly declining. It has provided stiff resistance for SBUX for over two months and will soon drive the stock through support if nothing else changes.
SBUX is one to watch closely in the coming week.
Be careful out there!
Full disclosure: no positions
