(T2108 measures the percentage of stocks trading above their respective 40-day moving averages [DMAs]. To learn more about it, see my T2108 Resource Page. You can follow real-time T2108 commentary on twitter using the #T2108 hashtag. T2108-related trades and other trades are posted on twitter using the #120trade hashtag)
T2108 Status: 70.4% (8th overbought day)
VIX Status: 18.0
General (Short-term) Trading Call: Continue selling bullish trades, open fresh bearish trades (do not accumulate) – watch out for earnings-related volatility
Reference Charts (click for view of last 6 months from Stockcharts.com):
S&P 500 or SPY
SDS (ProShares UltraShort S&P500)
U.S. Dollar Index (volatility index)
VIX (volatility index)
VXX (iPath S&P 500 VIX Short-Term Futures ETN)
EWG (iShares MSCI Germany Index Fund)
CAT (Caterpillar)
Commentary
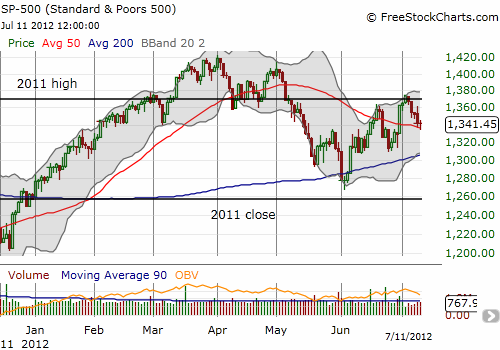
The S&P 500 fell for a 5th consecutive day and yet it still clings to its overbought status. With the stubborn index nestled on top of the 50DMA for a second straight day, it looks like the S&P 500 is poised for a bounce.

Note that the uptrend from the June lows remains intact, further supporting an upward bias.
Moreover, the volatility index has failed to respond much to the mild selling. At 18.0, the VIX is barely a point above where it was before the selling began.
Although the index is poised for a bounce, I am NOT recommending trading for a bounce. The T2108 rules do not allow me at this juncture to buy dips. The median overbought period lasts 4 days and the average duration is 9.2 days. This overbought period has now lasted eight days, so odds are rapidly increasing that the market gets at least one big sell-off to drop the S&P 500 from overbought. Fading a bounce from these levels makes a lot of sense.
This technical tension is playing out during an earnings season that has delivered a lot of bad news. While several individual stocks have been absolutely crushed by bad news, the S&P 500 overall has hung in there pretty well. I strongly suspect that lingering hopes for QE3 are helping to keep the market higher than it otherwise would be. Ironically enough, these same hopes are also allowing the Federal Reserve more time to decide. Any deep sell-off will certainly force its hand, just like in August, 2010.
In the meantime, I will keep my eyes trained on the technicals, and the signals tell me to continue fading rallies.
Daily T2108 vs the S&P 500
Click chart for extended view with S&P 500 fully scaled vertically (updated at least once a week)

Black line: T2108 (measured on the right); Green line: S&P 500 (for comparative purposes)
Weekly T2108

*All charts created using freestockcharts.com unless otherwise stated
Related links:
The T2108 Resource Page
Expanded daily chart of T2108 versus the S&P 500
Expanded weekly chart of T2108
Be careful out there!
Full disclosure: long SDS; long VXX shares; short VXX call spreads; long VXX puts
