(T2108 measures the percentage of stocks trading above their respective 40-day moving averages [DMAs]. To learn more about it, see my T2108 Resource Page. You can follow real-time T2108 commentary on twitter using the #T2108 hashtag. T2108-related trades and other trades are posted on twitter using the #120trade hashtag)
T2108 Status: 76.6% (5th overbought day)
VIX Status: 17.1
General (Short-term) Trading Call: Continue selling bullish trades, open fresh bearish trades (do not accumulate) – watch out for earnings-related volatility
Reference Charts (click for view of last 6 months from Stockcharts.com):
S&P 500 or SPY
SDS (ProShares UltraShort S&P500)
U.S. Dollar Index (volatility index)
VIX (volatility index)
VXX (iPath S&P 500 VIX Short-Term Futures ETN)
EWG (iShares MSCI Germany Index Fund)
CAT (Caterpillar)
Commentary
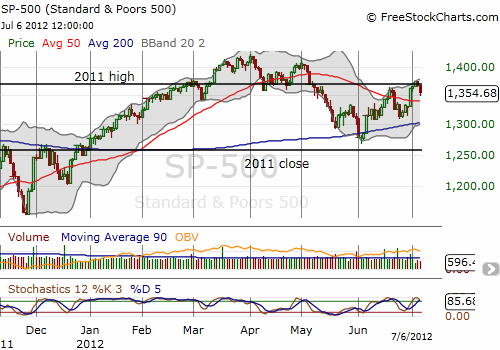
The S&P 500 fell back from resistance at the 2011 high as it sold off as much as 1.4% on the day. Surprisingly, T2108 only fell to 76.6% and the VIX even dropped, driving VXX from a small gain to a small loss. Notice in the the chart below of the S&P 500 that stochastics are also overbought.

Note that the upward momentum still holds from the June low as defined by the 200DMA. A change in character for the S&P 500 will not occur until either resistance breaks or the momentum from the bounce breaks. For a closer look at the intraday action on Friday, July 6, see my post on Seeking Alpha: “How Divergences Between The Australian Dollar And The S&P 500 Can Signal Trades.” In particular, the U.S. dollar is already retesting the top of the presumed trading range bounded on top by the “QE2 Reference price.”
Volatility also fell, I believe mostly on the late rally into the close (based on looking at VXX). This divergence suggests that buyers remain quite willing to continue pushing the index higher through these overbought conditions. Extremely light trading volume during the past two days of selling is also good news for the bulls. However, time is now working against the bulls with the overbought period on its fifth day. The median overbought period is 4 days and the average is 9.2 days.
With another earnings season upon us, company expectations for the second half of the year present the largest wildcard to the short-term outlook. Based on some very bad warnings and guidance last week from various high-tech companies, we should expect a lot of sour talk about demand in Europe. The first companies to report such news should get beaten up badly (like last week!), but in time, this news will get priced in and toward the end of earnings season, we could even see counter-intuitive rallies as the market concludes things are “not as bad as feared.” In other words, do not over-extrapolate the reactions from the first half of earnings season to the second half. Most importantly, companies with minimal exposure to Europe (and the global economy for that matter) should outperform although expectations may already be very high for these companies. Stay tuned!
Daily T2108 vs the S&P 500
Click chart for extended view with S&P 500 fully scaled vertically (updated at least once a week)

Black line: T2108 (measured on the right); Green line: S&P 500 (for comparative purposes)
Weekly T2108

*All charts created using freestockcharts.com unless otherwise stated
Related links:
The T2108 Resource Page
Expanded daily chart of T2108 versus the S&P 500
Expanded weekly chart of T2108
Be careful out there!
Full disclosure: long SDS; long VXX shares; short VXX call spreads
