(T2108 measures the percentage of stocks trading above their respective 40-day moving averages [DMAs]. To learn more about it, see my T2108 Resource Page. You can follow real-time T2108 commentary on twitter using the #T2108 hashtag. T2108-related trades and other trades are posted on twitter using the #120trade hashtag)
T2108 Status: 81.2% (3rd overbought day)
VIX Status: 16.7
General (Short-term) Trading Call: Continue selling bullish trades, open fresh bearish trades (do not accumulate)
Reference Charts (click for view of last 6 months from Stockcharts.com):
S&P 500 or SPY
SDS (ProShares UltraShort S&P500)
U.S. Dollar Index (volatility index)
VIX (volatility index)
VXX (iPath S&P 500 VIX Short-Term Futures ETN)
EWG (iShares MSCI Germany Index Fund)
CAT (Caterpillar)
Commentary
It is starting to feel like the stock market will not grant the opportunity to buy into the building rally on a decent dip. Echoes from the robust rally that began 2012 are now ringing louder and louder as I see additional confirmation that the June lows are going to get left far behind.
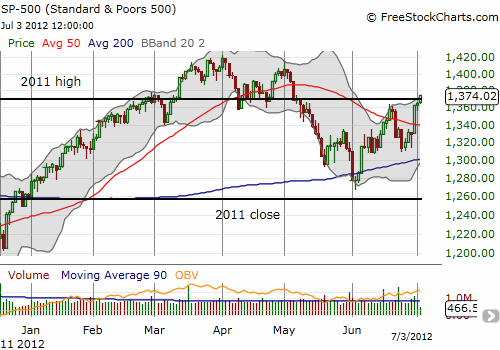
T2108 moved into extreme overbought territory on just the third day into this overbought period. At the same time, the S&P 500 nudged above critical resistance at the 2011 high. A complete recovery from May’s sharp selling is now close at hand.

It is important to remember that given so many stocks sold off so steeply into the June lows, there is a lot of upside room to rally. T2108 above 80% represents both strong buying pressure and the depths to which the 40DMA declined for many stocks.
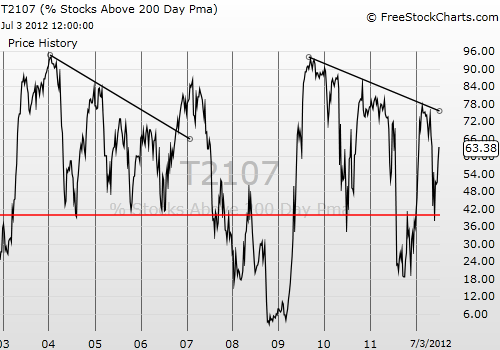
Another way to look at the upside potential for this rally is to pull out T2107, the percentage of stocks trading above their 200DMAs. Time and again, the stock market has shown it can only stretch so far relative to this indicator. T2107 is currently at 63%. Its peaks have arrived at lower and lower levels ever since the post-recession top in 2009. Assuming this pattern holds again, T2107 should run up to 73% or so before the current rally peaks. I include in the chart the similar behavior from the last bull market as a reminder that a break of this downtrend will extend the rally but possibly only to lead into another major top.

For short-term trades, I think it still makes sense to have on hand at least one short position. There are constant reminders of the risks inherent in the markets right now, and at any time a trader can find himself thankful for such a hedge. Although the market seems ready to push swiftly and strongly to the upside, this is not a time to get aggressively bullish. T2108 is overbought, and it is a time for taking profits not initiating new positions. On market dips, I am only initiating small positions that I intend to unload as quickly as practical.
Finally, VXX has taken two more plunges to fresh all-time lows as the VIX, the volatility index, settles down. While I felt like a genius selling my puts into Friday’s huge move down, I am not feeling so smart still holding the offsetting VXX shares without additional puts. I finally got back into some on Tuesday. VXX’s new rapid slide is another point of confirmation that the current rally should have staying power.
Black line: T2108 (measured on the right); Green line: S&P 500 (for comparative purposes)
Weekly T2108

*All charts created using freestockcharts.com unless otherwise stated
Related links:
The T2108 Resource Page
Expanded daily chart of T2108 versus the S&P 500
Expanded weekly chart of T2108
Be careful out there!
Full disclosure: long SDS; long VXX calls and shares

